

Investors consider gold and silver as safe haven investments. But the companies that produce gold and silver often offer volatile returns, creating opportunities for astute investors.
Volatility is a double-edged sword, particularly when it comes to commodity investing. During the good times, it can create skyrocketing returns. But during bad times, it can turn ugly.
Today's infographic comes to us from Prospector Portal, and shows how investing in precious metals equities can outperform or underperform the broader metals market.
Capitalizing on Volatility: Timing Matters
Just like most investments, timing matters with commodities.
Due to the complex production processes of commodities, unexpected demand shocks are met with slower supply responses. This, along with other factors, creates commodity supercycles—extended periods of upswings and downswings in prices.
Investors must time their investments to take advantage of this volatility, and there are multiple ways to do so.
Three Ways to Invest in Commodities
There are three primary routes investors can take when it comes to investing in commodities.
| Investment Method | Benefits | Limitations |
|---|---|---|
| Direct physical investment |
|
|
| Commodity futures |
|
|
| Commodity-related equities |
|
|
Among these, commodity-related equities offer by far the most leverage to changes in prices. Let's dive into how investors can use this leverage to their advantage with volatile metal prices.
The Fundamentals of Investing in Mining Equities
When it comes to commodity investing, targeting miners and mineral exploration companies presents fundamental benefits and drawbacks.
As metal prices rise, the performance of mining companies improves in several ways—while in deteriorating conditions, they do the opposite:
| Category | Rising Commodity Prices | Falling Commodity Prices |
|---|---|---|
| Outlook | - Improved outlook | - Deteriorated outlook |
| Stock Price Movement | - Equity growth | - Equity decline |
| Dividend Payouts | - Increased dividends | - Decreased dividends |
| Financial Performance | - Increased earnings | - Decreased earnings |
With the right timing, these ups and downs can create explosive opportunities.
Mining companies, especially explorers, use these price swings to their advantage and often produce market-beating returns during an upswing.
But how?
The Proof: How Mining Equities React to Metal Prices
Not only do price increases translate into higher profits for mining companies, but they can also change the outlook and value of exploration companies. As a result, investing in exploration companies can be a great way to gain exposure to changing prices.
That said, these types of companies can generate greater equity returns over a shorter period of time when prices are high, but they can also turn dramatically negative when prices are low.
Below, we compare how producers and exploration companies with a NI-43-101 compliant resource perform during bull and bear markets for precious metals.
All figures are in U.S. dollars unless otherwise stated.
| Mining Company | Company Stage | Primary Metal Produced | Market Cap. Oct 31, 2019 | Market Cap. July 29, 2020 | Bull Market Performance (Nov. 1, 2019-July 29, 2020) | Bear Market Performance (Jan 02 – Dec 31, 2018) |
|---|---|---|---|---|---|---|
| Banyan Gold | Exploration/ Development | Gold | $6M | $40M | 500% | -44% |
| Renforth Resources | Exploration | Gold | $8M | $10M | 11% | -10% |
| Auryn Resources | Exploration | Gold, Copper | $181M | $330M | 60% | -39% |
| Wesdome Gold Mines Ltd. | Production | Gold | $1,104M | $1,885M | 68% | 110% |
| Monarch Gold | Exploration/ Development | Gold | $57M | $148M | 139% | -23% |
| Red Pine Exploration | Exploration | Gold | $13M | $22M | 29% | -55% |
| Revival Gold Inc. | Exploration/ Development | Gold | $27M | $74M | 113% | 5% |
| Erdene Resource Development | Exploration/ Development | Gold | $36M | $111M | 222% | -56% |
| Endeavor Mining Corp. | Production | Gold | $2,622M | $5,874M | 54% | -13% |
| Yamana Gold Inc | Production | Gold | $4,572M | $8,279M | 87% | -22% |
During the bear market period, the price of gold declined by 2.66%, and despite engaging in exploration activity, most companies saw a slump in their share prices.
In particular, exploration companies, or juniors, took a heavier hit, with returns averaging -31.66%. But even during a bear market, a discovery can make all the difference—as was the case for producer Wesdome Gold Mines, generating a 109.95% return over 2018.
- Average returns for gold producers including Wesdome: 24.83%
- Average returns for gold producers excluding Wesdome: -17.65%
During the bull market period for gold, gold mining companies outperformed the price of gold, with juniors offering the highest equity returns averaging 153.43%. Gold producers outperformed the commodity market, the value of their equities increased 69.61%—less than half of that of exploration companies.
Silver: Bears vs Bulls
Similar to gold mining companies, performances of silver producers and explorers reflected the volatility in silver prices:
| Company | Company Stage | Primary Metal Produced | Market Cap. Oct 31, 2019 | Market Cap. July 29, 2020 | Bull Market Performance (Nov. 1, 2019-July 29, 2020) | Bear Market Performance (Jan 02 – Dec 31, 2018) |
|---|---|---|---|---|---|---|
| Silvercrest Metals | Exploration | Silver | $694M | $1,449M | 78% | 117% |
| Pan American Silver | Production | Silver | $2,973M | $10,550M | 125% | 1% |
| Golden Minerals | Exploration | Silver | $30M | $80M | 80% | -42% |
| Americas Gold and Silver | Production | Silver | $335M | $482M | 10% | -56% |
| Dolly Varden Silver Corp. | Exploration | Silver | $28M | $74M | 152% | -32% |
| Endeavour Silver | Production | Silver, Gold | $458M | $837M | 72% | -10% |
During the bear market period for silver, its price decreased by 9.8%. Explorers and producers both saw a dip in their share prices, with the equity of silver producers decreasing by 21.63%.
However, the discovery of a high-quality silver deposit again made the difference for SilverCrest Metals, which generated a 116.85% return over the year.
- Average returns for silver exploration companies including SilverCrest: 8.32%
- Average returns for silver exploration companies excluding SilverCrest: -27.86%
On the other hand, during the bull market period, the price of silver increased by 34.33%. Silver exploration companies surpassed the performance of the price of silver.
- Average returns for silver producers: 69.04%
- Average returns for silver exploration companies: 95.36%
The potential to generate massive returns and losses is evident in both cases for gold and silver.
The Investment Potential of Exploration
Mining equities tend to outperform underlying commodity prices during bull markets, while underperforming during bear markets.
For mining exploration companies, these effects are even more pronounced—exploration companies are high-risk but can offer high-reward when it comes to commodity investing.
To reap the rewards of volatile returns, you have to know the risks and catch the market at the right time.

Gold
Comparing Recent U.S. Presidents: New Debt Added vs. Precious Metals Production
While gold and silver coin production during U.S. presidencies has declined, public debt continues to climb to historically high levels.
Published
3 days agoon
October 29, 2020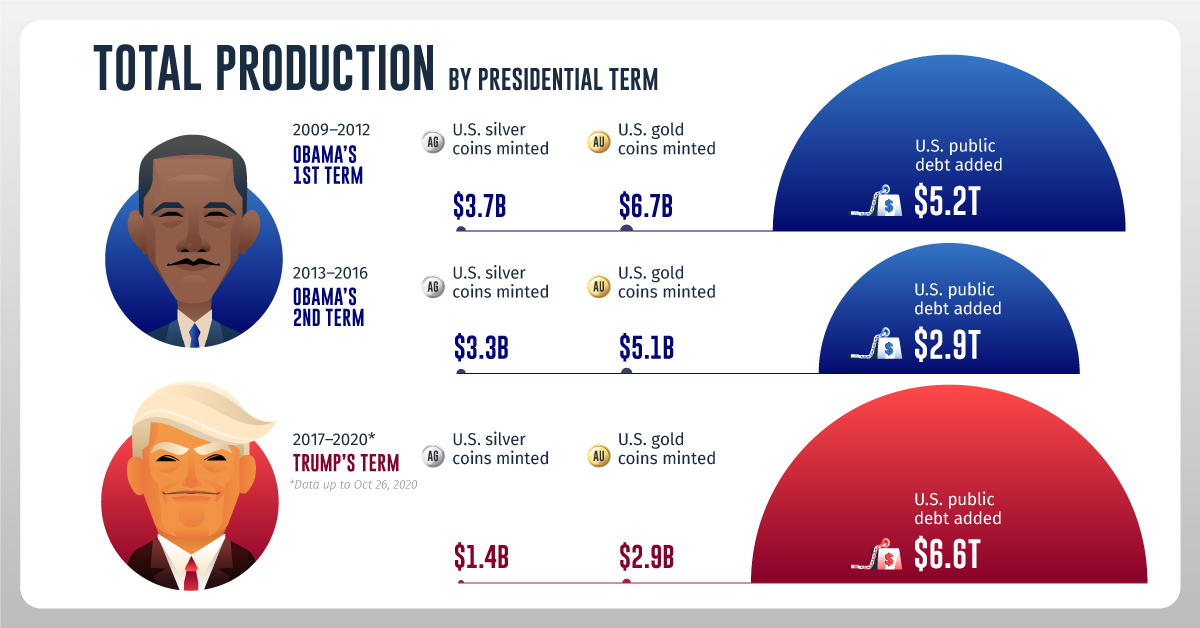
Recent U.S. Presidents: Debt vs. Coins Added
While precious metals can't be produced out of thin air, U.S. debt can be financed through central bank money creation. In fact, U.S. debt has skyrocketed in recent years under both Democrat and Republican administrations.
This infographic from Texas Precious Metals compares the increase in public debt to the value of gold and silver coin production during U.S. presidencies.
Total Production by Presidential Term
We used U.S. public debt in our calculations, a measure of debt owed to third parties such as foreign governments, corporations, and individuals, while excluding intragovernmental holdings. To derive the value of U.S. minted gold and silver coins, we multiplied new ounces produced by the average closing price of gold or silver in each respective year.
Here's how debt growth stacks up against gold and silver coin production during recent U.S. presidencies:
| Obama's 1st term (2009-2012) | Obama's Second Term (2013-2016) | Trump's term (2017-Oct 26 2020) | |
|---|---|---|---|
| U.S. Silver Coins Minted | $3.7B | $3.3B | $1.4B |
| U.S. Gold Coins Minted | $6.7B | $5.1B | $2.9B |
| U.S. Public Debt Added | $5.2T | $2.9T | $6.6T |
Over each consecutive term, gold and silver coin production decreased. In Trump's term so far, the value of public debt added to the system is almost 1,600 times higher than minted gold and silver coins combined.
During Obama's first term and Trump's term, debt saw a marked increase as the administrations provided fiscal stimulus in response to the global financial crisis and the COVID-19 pandemic. As we begin to recover from COVID-19, what might debt growth look like going forward?
U.S. Public Debt Projections
As of September 30, 2020, the end of the federal government's fiscal year, debt had reached $21 trillion. According to estimates from the Congressional Budget Office, it's projected to rise steadily in the future.
| 2021P | 2022P | 2023P | 2024P | 2025P | 2026P | 2027P | 2028P | 2029P | 2030P | |
|---|---|---|---|---|---|---|---|---|---|---|
| U.S. Public Debt | 21.9T | 23.3T | 24.5T | 25.7T | 26.8T | 27.9T | 29.0T | 30.4T | 31.8T | 33.5T |
| Debt-to-GDP ratio | 104.4% | 105.6% | 106.7% | 107.1% | 107.2% | 106.7% | 106.3% | 106.8% | 107.4% | 108.9% |
By 2030, debt will have risen by over $12 trillion from 2020 levels and the debt-to-GDP ratio will be almost 109%.
It's worth noting that debt will likely grow substantially regardless of who is elected in the 2020 U.S. election. Central estimates by the Committee for a Responsible Federal Budget show debt rising by $5 trillion under Trump and $5.6 trillion under Biden through 2030. These estimates exclude any COVID-19 relief policies.
What Could This Mean for Investors?
As the U.S. Federal Reserve creates more money to finance rising government debt, inflation could eventually be pushed higher. This could affect the value of the U.S. dollar.
On the flip side, gold and silver have a limited supply and coin production has decreased over the last three presidential terms. Both can act as an inflation hedge, while playing a role in wealth preservation.
Gold
The World's Gold and Silver Coin Production vs. Money Creation
In 2019, the value of global money creation was over 500 times higher than the world's gold and silver coin production combined.
Published
2 weeks agoon
October 15, 2020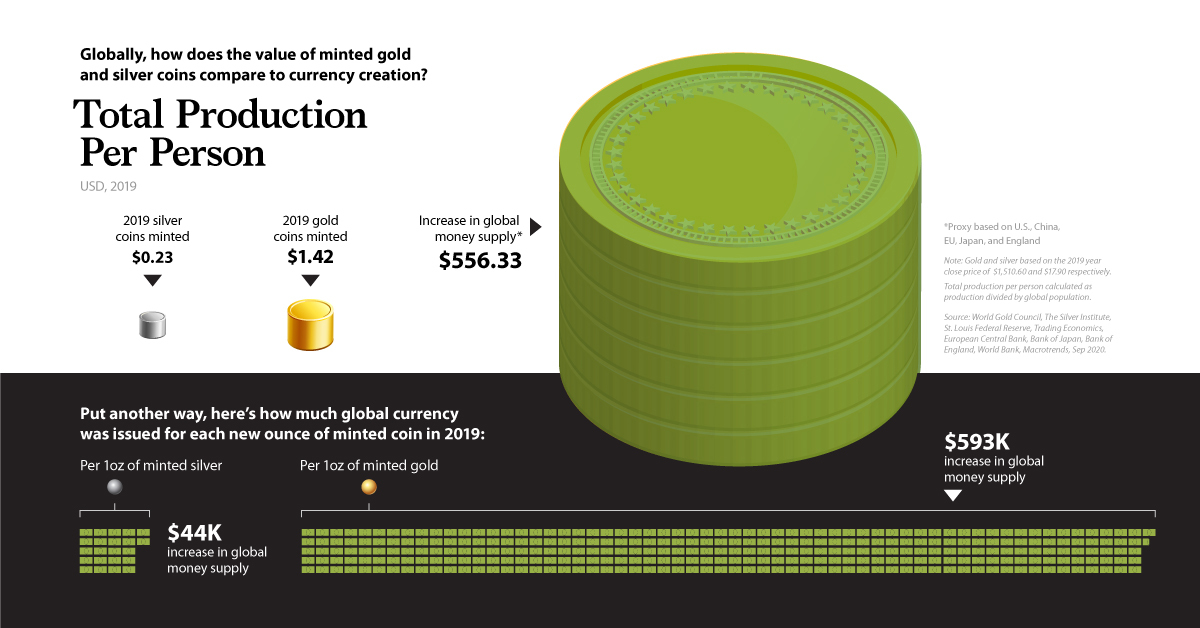
Global Gold & Silver Coin Production vs. Money Creation
Note: Data has been updated to correct a previous calculation error pertaining to Japanese Yen money supply.
Both precious metals and cash serve as safe haven assets, intended to limit losses during market turmoil. However, while modern currencies can be printed by central governments, precious metals derive value from their scarcity.
In this infographic from Texas Precious Metals, we compare the value of the world's gold and silver coin production to global money creation.
Total Production Per Person, 2019
We calculated the value of global currency issuance in 2019 as well as precious metal coins minted, and divided by the global population to get total production per person.
Throughout, global money supply is a proxy based on the 5 largest reserve currencies: the U.S. dollar, Euro, Japanese Yen, Sterling Pound, and Chinese Renminbi.
| 2019 Production | Ounces | Dollar Value | Dollar Value Per Person |
|---|---|---|---|
| Global Gold Coins | 7,204,982 | $10.9B | $1.42 |
| Global Silver Coins | 97,900,000 | $1.8B | $0.23 |
| Global Money Supply | $4.3T | $556.33 |
All numbers are in USD according to exchange rates as of December 31 2019. Gold and silver values are based on the 2019 year close price of $1,510.60 and $17.90 respectively.
The value of new global money supply was 390 times higher than the value of gold coins minted, and 2,400 times higher than silver coins minted.
Put another way, for each ounce of minted gold coin, the global money supply increased by more than $593,000.
Change in Annual Production, 2019 vs. 2010
Compared to the start of the decade, here's how annual production levels have changed:
| 2010 | 2019 | % change | |
|---|---|---|---|
| Global Silver Coins (oz) | 95,900,000 | 97,900,000 | 2.1% |
| Global Gold Coins (oz) | 6,298,331 | 7,204,982 | 14.4% |
| Global Money Supply (USD) | $2,936,296,692,440 | $4,268,993,639,926 | 45.4% |
Annual increases to global money supply have increased by half, far outpacing the change in the world's gold and silver coin production.
Even more recently, how has production changed during the COVID-19 pandemic?
The COVID-19 Effect
In response to the global pandemic, central banks have enacted numerous measures to help support economies—including issuing new currency.
The global money supply increased by more than $6.8 trillion in the first half of 2020. In fact, the value of printed currency was 930 times higher than the value of minted gold coins over the same timeframe.
Investors may want to consider which asset is more vulnerable to inflation as they look to protect their portfolios.
Want to learn more? See the U.S. version of this graphic.


No comments:
Post a Comment
Commented on MasterMetals