Search This Blog

Showing posts with label ETF. Show all posts

February 12, 2021

#Platinum group metals outlook: constrained supply, very strong demand growth – WPIC $PPLT

Platinum

The outlook for platinum group metals (PGMs) is one of constrained supply and very strong demand growth. “You’ve got the entire PGMs suite that is short and that certainly will translate into tight markets,” World Platinum Investment Council (WPIC) Director of Research Trevor Raymond told Mining Weekly in a Zoom interview on Monday. (Also watch attached Creamer Media video.)

“The most material driver is the substitution of palladium by platinum. I think we’re starting to see widespread recognition that it’s happening but it’s still proprietary and confidential. We’re starting to see estimates of anything between one and one-and-a-half-million ounces of substitution, people are saying, by 2025. It’s our view that it’s happening a lot quicker and will be a lot sooner. But that’s quite a material growth. You're looking at another one-million ounces within four years in the platinum market. That’s pretty strong demand,” he said.

“Also, the other thing that’s driving demand is investment.

June 15, 2020

#Gold Companies In, #Energy Out! $DPM, $EQX, $LUG, $SIL, $TGZ Added to S&P/TSX COMPOSITE INDEX

#Gold Companies form the core of companies Added, while Oil & Gas Co.'s represent majority of Deletions.

Dundee Precious Metals ($DPM), Equinox Gold ($EQX), Lundin Gold ($LUG), SilverCrest Metals ($SIL), Teranga Gold ($TGZ) Added to the S&P/TSX COMPOSITE INDEX 

#Gold Companies In, #Energy Out!

S&P Dow Jones Indices Announces Changes to the S&PTSX Composite Index and S&PTSX 60 Index.html 

TORONTOJune 12, 2020 /CNW/ - As a result of the quarterly review, S&P Dow Jones Indices will make the following changes in the S&P/TSX Composite Index and S&P/TSX 60 Index prior to the open of trading on Monday, June 22, 2020:

May 7, 2020

Inflows into #Gold #ETF’s for a sixth straight month in April boosting holdings to new all-time high of 3,355t $GLD


Globally, gold-backed ETFs (gold ETFs) added 170 tonnes(t) – net inflows of US$9.3bn (+5.1%) – in April, boosting holdings to a new all-time high of 3,355t.1 Assets under management (AUM) also reached a new record high of US$184bn as gold in US dollars moved higher by 5.8%. Inflows have been strong and consistent in recent months, but not unprecedented. Rolling twelve-month inflows of 879t just surpassed those of 2009 and 2016, while rolling six-month inflows are less than two-thirds of the 457t of inflows in the comparable time periods of 2009 and 2016.


________________________
bit.ly/MasterMetals

February 6, 2020

As #Gold prices rose in 2019, investors jumped into #ETF’s | World @GoldCouncil


Gold Demand Trends Full year and Q4 2019 | World Gold Council
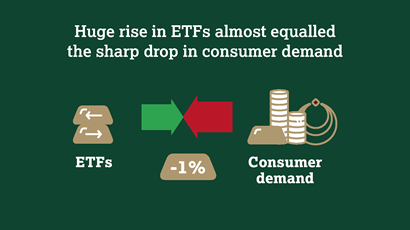
Huge rise in ETF inflows almost equalled the sharp drop in consumer demand in 2019


The net result was a marginal 1% decline in annual demand to 4,356t.

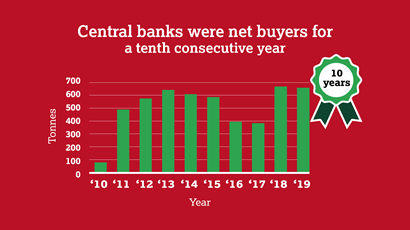
Global reserves grew by 650t – the second highest annual total.

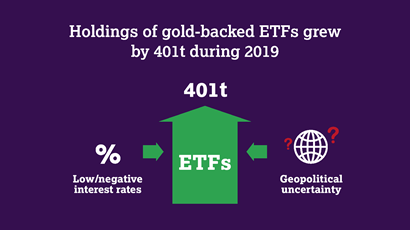
Low/negative interest rates and geopolitical uncertainty fuelled this growth, while the gold price rally also attracted momentum-driven inflows.

Highlights

Annual gold demand in 2019 dips 1% to 4,355.7t

Total fourth quarter demand fell 19% y-o-y to 1,045.2t. Two main contributors to the y-o-y drop were jewellery and physical bar demand, both of which reacted to the elevated gold price. In US dollar value terms, the decline in Q4 demand was much shallower – down just 3% to US$49.7bn.
Inflows into global gold-backed ETFs and similar products pushed total holdings to a record year-end total of 2885.5t. Holdings grew by 401.1t over the year, with 26.8t added in Q4. Inflows were heavily concentrated in Q3 as the US dollar gold price rallied to a six-year high.
Central banks were net buyers for a 10th consecutive year: global reserves grew by 650.3t (-1% y-o-y), the second highest annual total for 50 years. Purchasing in Q4 of 109.6t was 34% lower y-o-y, although this was partly a reflection of the sheer scale of buying in 2018. 
China and India held sway over global consumer demand.

January 1, 2020

#Gold #ETF's (Canada & US) 2019 Performance $GDX $XGD.to


XGD +39.88%
GDX +39.79% 

#Gold was a stealthy performer during 2019. Although there was not a full fledged Bull Market all-around, some of the Gold Mining equities did handsomely well. 


December 15, 2019

The World’s Wealthy Are Hoarding #Gold - Physical not #ETF‘s

At least that's what Goldman Sachs says...
The Wealthy Are Hoarding Physical Gold
The world's rich are hoarding gold – this according to data buried in a recent Goldman Sachs note to clients.
In the note published over the weekend, Goldman recommended diversifying long-term bond holdings with gold, citing "fear-driven demand" for the yellow metal.


The Goldman note cited political uncertainty and recession fears as the catalyst for the move toward gold. It also mentioned worries about a wealth tax, increasing interest in Modern Monetary Theory (essentially money-printing) and the current loose central bank monetary policy.
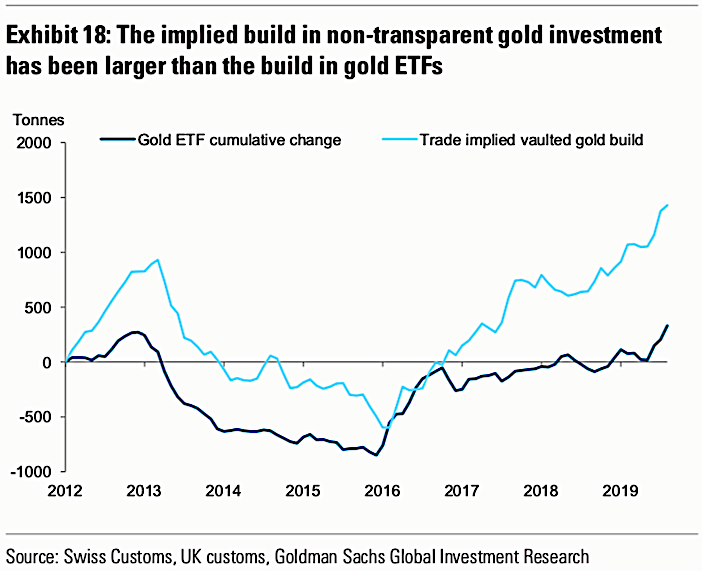
Data buried in the note also revealed that owning physical gold appears to be the preferred method to "hedge against tail events" by the rich.
"Since the end of 2016 the implied build in non-transparent gold investment has been much larger than the build in visible gold ETFs."

October 2, 2019

#Gold’s price, is a key “signal amid the increasing noise of macroeconomic data.”


"Gold prices have been given little airtime in discussions of "serious" investment strategy. But even if you have no intention of considering an allocation to gold, there is a value in keeping an eye on the price, as it can be an interesting signal amid the increasing noise of macroeconomic data."
"Even when it is strengthening, the gold price is surprising. To the extent gold is an alternative store of value to the US dollar, it would be expected to move in the opposite direction to the currency. But recently it has been making material gains despite a strengthening dollar. Signs that the gold price is defying conventional wisdom suggest we should dig a little deeper."

Read today's opinion piece in the FT:

Why Buffett is wrong to dismiss the benefits of gold

Yellow metal provides a useful indication of economic expectations


Warren Buffett's group reported a staggering cash balance of $122bn
Warren Buffett's group reported a staggering cash balance of $122bn © AP
Legendary investor Warren Buffett's much-quoted dismissal of the investment merits of gold is simple: the metal is "neither of much use nor procreative." But the Oracle of Omaha has got this wrong. Gold is constantly offering useful insights, if you look closely enough...

March 1, 2017

#Gold #ETF - The big buyers are in Germany $XETRA


Unlike a year ago when the big ETF buyers were in the U.S., this time it's the Germans. They are buying XETRA-Gold, the exchange-traded fund backed by bullion. Investors poured almost US$ 906MM into this ETF this month, the biggest inflow since inception in 2007. As of February 13, holdings were estimated at 157.9 metric tons (attachment 1).

The motivations of the buying are political. The uncertainty about BREXIT, U.S. politics, and elections in Holland (March) and France (1st round April, second round May).

The latest buying spree by them was done between US$ 1,220 per ounce and US$ 1,250 per ounce. Attachment 2 shows the sharp and long decline of gold from 2012 with a low in January 2016 round US$ 1,040 per ounce. After that a rally occurred till July 2016 to around US 1,370 and subsequently gold fell back to around US$ 1,125 per ounce. The current rally is still considered to be against the major trend, which is down. A breakout over US$ 1,350 per ounce would signal the end of the bear market. Gold is not out of the woods yet.


October 15, 2014

May 17, 2012

Global #gold demand in Q1 2012 was 1,097.6 tonnes (t), down 5% - China, central banks and ETFs underpin demand for gold World Gold Council

Global gold demand in Q1 2012 was 1,097.6 tonnes (t), down 5% from the high demand levels seen in Q1 2011 (1,150.7t) 

World Gold Council


China, central banks and ETFs underpin demand for gold

17 May, 2012


Global gold demand in Q1 2012 was 1,097.6 tonnes (t), down 5% from the high demand levels seen in Q1 2011 (1,150.7t), according to the World Gold Council’s Gold Demand Trends report. This decrease was largely to be expected given the introduction of import taxes in India and high gold prices. Gold demand value however, showed a 16% increase year on year to an estimated US$59.7 billion. The average price of gold for the quarter was US$1,690.57, 22% higher than the average for Q1 2011. Demand for the quarter was underpinned by increased demand in China, continued central bank purchasing and inflows into exchange-traded funds (ETFs).


The main highlights from the report are as follows:
China’s investment and jewellery demand reached 255.2t up 10% on the previous year’s levels. Investment demand recorded strong growth with a quarterly record of 98.6t, up 13% from Q1 2011, demonstrating investors’ continued need to preserve wealth amidst ongoing concerns over inflation. Jewellery demand in China also increased significantly to 156.6t, accounting for 30% of global jewellery demand making China the largest jewellery market for the third consecutive quarter.
Gold demand in India was affected in Q1 2012 by a number of factors; a new tax on gold jewellery, two increases in the import duty for gold and weakness and volatility in the rupee. Jewellery demand fell 19% to 152.0t from Q1 2011. Investment demand was down 46% from the previous year at 55.6t. In May, the government withdrew the new tax on jewellery and the market is already responding positively.
Central banks across the globe continued the now established trend of net purchasing with demand in Q1 2012 reaching 80.8t. Demand was driven by Eastern Europe with Russia and Kazakhstan adding to their holdings and accounting for a substantial amount of the purchasing. Mexico’s central bank made the largest single purchase of 16.8t. The main driver for this demand by emerging market central banks is the need to diversify their holdings.
First quarter demand for ETFs and similar products totalled 51.4t, equivalent to a value of US$2.8bn; in stark contrast to the first quarter of 2011, when the sector witnessed net outflows.


Marcus Grubb, Managing Director, Investment at the World Gold Council said,


“China and India have seen continuing economic growth and whilst China’s economy is expected to slow, it will nonetheless surpass the rates of growth in the West. As we previously forecast it is likely China will become the largest source of demand for gold in 2012.


This growth story also extends to other emerging market economies and is reinforced by central banks’ continued buying of gold, as a diversifier and a preserver of national wealth. The current picture of the gold market is diverse and not withstanding a flight into US dollars and treasuries near term, we believe the fundamental reasons for investing in gold today remain very strong and compelling.”
Gold demand and supply statistics for Q1 2012:
First quarter gold demand of 1,097.6t was down 5% in comparison to Q1 2011 though in line with the average of the preceding eight quarters.
The value measure of gold demand was 16% higher year-on-year at US$59.7bn.
Demand in the jewellery sector of 519.8t was down 6% year-on-year, which when considered against a rise in prices of 22% shows resilience in jewellery demand. Increasing prices are leading to a re-premiumisation of gold, as it becomes even more exclusive. In US$ terms, the value of jewellery demand grew by 14% to a record US$28.3 billion.
The average gold price of US$1,690.57 was 22% higher than the average of Q1 2011. As a result, in value terms, virtually all sectors of gold demand posted year-on-year increases, with the exception of physical bar demand, which was broadly flat, and the official sector, where purchasing activity was below Q1 2011’s exceptional levels.
First quarter gold investment demand (including gold bars, coins, ETFs and similar products) grew by 13% year-on-year to 389.3t. In US$ terms, this equated to a demand value of US$21.2bn, 38% higher year-on-year. Increases in demand for ETFs and medals/imitation coins meant that demand reached 389.3t, 45.8t above Q1 2011 despite declines in demand for physical bars and coins.
At 107.7t, demand for gold used in the technology and industrial sectors was down by 7% compared with year-earlier levels.


The Q1 2012 Gold Demand Trends report, which includes comprehensive data provided by Thomson Reuters GFMS, can be viewed here.

17 May, 2012, China, central banks and ETFs underpin demand for gold Media World Gold Council

July 18, 2011

Gold`s journey toward $1,600


Gold's journey toward $1,600

The yellow metal briefly touched a record high above $1,600 dollars on Monday as deft fears continued to grow, but there have been other steps in gold's rise toward a new record

Posted: Monday , 18 Jul 2011


(REUTERS) -
Gold prices hit record highs above $1,598 an ounce on  Monday, buoyed by investors seeking a safer place to store their value as the U.S. deficit talks stalled and euro zone debt crisis continued to unfold.

Following are key dates in gold's trading history since the early 1970s:
* August 1971 - U.S. President Richard Nixon takes the dollar off the gold standard, which had been in place with minor modifications since the Bretton Woods Agreement of 1944 fixed the conversion rate for one Troy ounce of gold at $35.
* August 1972 - The United States devalues the dollar to $38 per ounce of gold.
* March 1973 - Most major countries adopt floating exchange rate system.
* May 1973 - U.S. devalues dollar to $42.22 per ounce.
* January 1980 - Gold hits record high at $850 per ounce. High inflation because of strong oil prices, Soviet intervention in Afghanistan and the impact of the Iranian revolution prompt investors to move into the metal.
* August 1999 - Gold falls to a low at $251.70 on worries about central banks reducing reserves of gold bullion and mining companies selling gold in forward markets to protect against falling prices.
* October 1999 - Gold reaches a two-year high at $338 after agreement to limit gold sales by 15 European central banks. Market sentiment toward gold begins to turn more positive.
* February 2003 - Gold reaches a 4-1/2 year high on safe-haven buying in the run-up to the invasion of Iraq.
* December 2003-January 2004 - Gold breaks above $400, reaching levels last traded in 1988. Investors increasingly buy gold as risk insurance for portfolios.
* November 2005 - Spot gold breaches $500 for the first time since December 1987, when spot hit $502.97.
* April 11, 2006 - Gold prices surpass $600, the highest point since December 1980, with funds and investors pouring money into commodities on a weak dollar, firm oil prices and geopolitical worries.
* May 12, 2006 - Gold prices peak at $730 an ounce with funds and investors pouring money into commodities on a weak dollar, firm oil prices and political tensions over Iran's nuclear ambitions.
* June 14, 2006 - Gold falls 26 percent to $543 from its 26-year peak after investors and speculators sell out of commodity positions.
* November 7, 2007 - Spot gold hits a 28-year high of $845.40 an ounce.
* January 2, 2008 - Spot gold breaks above $850.
* March 13, 2008 - Benchmark gold contract trades over $1,000 for the first time in U.S. futures market.
* March 17, 2008 - Spot gold hits an all-time high of $1,030.80 an ounce. U.S. gold futures touch record peak of $1,033.90.
* September 17, 2008 - Spot gold rises by nearly $90 an ounce, a record one-day gain, as investors seek safety amid turmoil on the equity markets.
* Jan-March 2009 - Gold-backed exchange-traded funds report record inflows in the first quarter as financial sector insecurity spurs safe-haven buying. Holdings of the largest, the SPDR Gold Trust, rise 45 percent to 1,127.44 tonnes.
* February 20, 2009 - Gold rises back above $1,000 an ounce to a peak of $1,005.40 as investors buy bullion as a safe store of value as major economies face recession and equity markets tumble.
* April 24, 2009 - China announces it has raised its gold reserves by three-quarters since 2003 and now holds 1,054 tonnes of the precious metal, boosting expectations it may add further to its reserves.
* August 7, 2009 - European central banks opt to renew their earlier agreement to limit gold sales over a five-year period, setting the sales cap at 400 tonnes a year.
* September 8, 2009 - Gold breaks back through $1,000 an ounce for the first time since February 2009 on dollar weakness and concerns over the sustainability of the economic recovery.
* December 1, 2009 - Gold climbs above $1,200 an ounce for the first time as the dollar drops.
* December 3, 2009 - Gold hits record high at $1,226.10 an ounce, with dollar weakness and expectations for central banks to diversify reserves into gold driving prices higher.
* May 11, 2010 - Gold reaches fresh record high above $1,230 an ounce as fears over the contagion of debt issues in the euro zone fuel safe-haven buying.
* June 21, 2010 - Gold jumps to a new high at $1,264.90 an ounce as underlying fears over financial market stability and sovereign risk combine with dollar weakness to push the metal through resistance at its previous high.
* Sept 14, 2010 - Gold climbs back to record highs, this time at $1,274.75, as global markets reflect renewed uncertainty on the economic outlook.
* Sept 16-22, 2010 - Gold hits record highs for five successive sessions, peaking at $1,296.10, as investors flock to bullion after the Fed signals it may consider further quantitative easing, weakening the dollar and raising fears over future inflation.
* Sept 27 - Spot gold prices touch the $1,300 an ounce mark for the first time.
* Oct 7 - Gold rallies to a record high above $1,360 an ounce as the dollar comes under pressure from building expectations for the U.S. Federal Reserve to take extra measures to keep interest rates low and prop up the economy.
* Oct 13 - Gold jumped to record highs near $1,375 an ounce as the dollar continued to languish, with the U.S. unit coming under pressure after minutes from the Fed's September meeting signaled the U.S. economy may need further stimulus.
* Nov 8 - Gold prices break through the $1,400 an ounce mark for the first time as haven buying prompted by renewed budget problems in Ireland more than offset a sharp dollar bounce.
* Dec 7 - Gold reaches a fresh record high above $1,425 an ounce, driven by fund buying ahead of year-end, jitters over the euro zone debt crisis and speculation for further U.S. monetary easing.
* January 2011 - Gold prices fall more than 6 percent in their worst monthly performance in over a year as a revival in risk appetite diverts investment to higher-yielding assets.
* March 1 - Gold recovers to hit a record high at $1,434.65 an ounce as unrest in Tunisia and Egypt spreads across the Middle East and North Africa, boosting oil prices.
* March 7 - Gold extends record highs to $1,444.40 an ounce as oil prices hit their highest in 2-1/2 years after protests are quashed in Saudi Arabia and as violence in Libya rages.
* March 24 - The resignation of Portuguese prime minister Jose Socrates pushes the euro zone debt crisis back to center stage, lifting gold prices to a record above $1,447 an ounce.
* April 7 - Gold prices extended their record highs toward $1,465 an ounce after the European Central Bank cast doubts over expectations for interest rate rises, while unrest in the Middle East encouraged safe-haven buying.
* July 18 - Gold hit a record of $1,598.41 an ounce, on track for an eleventh straight day of gains, on persistent worries about euro zone debt crisis spreading and a growing threat of a U.S. government default.
(Compiled by Atul Prakash, Jan Harvey, Amanda Cooper and Rujun Shen; Editing by Himani Sarkar)

"Gold's journey toward $1,600
The yellow metal briefly touched a record high above $1,600 dollars on Monday as deft fears continued to grow, but there have been other steps in gold's rise toward a new record"

Mineweb.com - The world's premier mining and mining investment website Gold`s journey toward $1,600 - FAST NEWS | Mineweb:


_______________________________________
Check it out on The MasterMetals Blog

April 6, 2011

Coal ETFs burn bright

FT.com - Commodities News and Market Data
April 06, 2011
ETFs linked to the coal industry have seen an upsurge in interest following the crisis at the Fukushima nuclear plant in Japan and flooding in Queensland which has disrupted coal production in Australia.

View article...

ShareThis

MasterMetals’ Tweets