Search This Blog

Showing posts with label GDX. Show all posts

July 8, 2021

#Gold - #GoldenCross at hand?

Gold - Golden Cross?

The daily chart of the gold futures shows the 50-day moving average (blue line) crossing the 200-day moving average (red line).

This is called a golden cross. The golden cross is a technical chart pattern indicating the potential for a major rally.

The MACD (lower chart) is very oversold and crossing the red lineThis supports higher prices. The Relative Strength (RSI) (upper chart) is also pointing higher.

There's a feeling that the gold price is currently being held back by silver prices, as the July silver futures contract is in the delivery month and the open interest, which is high, indicates holders of the contracts are demanding delivery.  ðŸ˜¥ 

Silver 30 minutes Chart


The 30-minutes Silver Chart (1 bar every 30 minute), shows how the Big Boys are putting pressure on silver prices for this very purpose.  Once this is done, we could expect higher prices for Gold & Silver across the board. 

Stay tuned! 

May 17, 2021

#GOLD: Getting ready to break out —UPDATED! $GLD

GOLD looking to break through the 200 Day Moving Average. 

The 20 Day Moving Average has also crossed the 100 Day Moving Average to the upside portending better times ahead for the "Barbarous Relic". 

That’s what it looked like this morning May 17, 2021 before Gold broke out. 

This is what it looked like after:

Looking bullish! 


______________________________

December 13, 2020

#Gold’s recent sell off had less to do with fundamentals, and everything to do with clearing out the “jokers” who wanted to take delivery of their December Gold Contracts.


#Gold - Some #TechnicalAnalysis on the Current State of the Market 

Gold futures prices (paper gold) were able to cross on the upside the 200-day moving average (pink line). It all looks like the low of around US$ 1'760 per ounce may just have been an aberration and the result of technical selling by the Powers That Be, aka the PPT. It had nothing to do with fundamentals, and everything to do with clearing out all the jokers who wanted to take delivery of their December Gold Contracts. The MACD turned positive as it crossed  the red line.

What is needed now is a consolidation period in the next few weeks before year end, at which time Gold always outperforms? 

Attachment 2 displays the GDX (VanEck Vectors Gold  Miners ETF), the largest ETF investing in gold mining shares. The washout to around US$ 33 is probably the low in this short-term correction. The Relative Strength (upper chart) and the MACD (lower chart) have turned up. What we need here is a bottom formation over the next few weeks.

 
Attachment 3 shows where some gold producers are selling vs. implied premium/discount to spot gold.
 
Only B2Gold (BTO) is selling at a premium, while Lundin Gold (LUG), Pretium Resources(PVG) and Kirkland Lake Gold (KL) are close to neutral. All the rest are selling at a discount, and some at a heavy discount. The red figure represents the average, currently close to a 20% discount.
 
PG=Premier Gold, 
AR=Argonaut Gold, 
OGC=Oceana Gold,
KNT=K92 Mining, 
TXG=Torex Gold, 
GAU=Galiano Gold,
NGD=New Gold, 
CG=Centerra Gold, 
SSRM=SSR Mining,
EQX=Equinox Gold, 
DPM=Dundee  Precious Metals, 
AGI=Alamos Gold, 
GSS=Golden Star Resources.

 
The upper percentage figure is historically the high, and the lower percentage figure historically the lower level of trading in relation to the spot gold price. The blue diamond is the current status. 

(Source Scotiabank)


Attachment 4 shows the Point&Figure chart of the Philadelphia Gold &Silver Index (XAU). Contrary to the ARCA Gold Bugs Index (HUI), XAU also includes silver shares. It is used as a benchmark for gold funds to compare performance. The chart shows the sideways correction since August  (8 red figure).
 
 Attachment 5 displays the holdings.
 
It should always be remembered that at the heart of any successful strategy, is to buy low and sell high. Currently, we’re still in the Buy Low point of this Precious Metals Bull Market

____________________________________________________

June 22, 2020

Will #Gold #miners struggle to maintain 2019 production levels?


Prior to the coronavirus outbreak, peak gold supply was becoming a real possibility. Now, with exploration programs halted or cancelled and project disruptions hampering production, will Gold miners struggle to maintain 2019 production levels, as Wood Mac says

May 18, 2020

Is #Gold Setting Itself Up For A Fall? #HeadAndShoulders? $GLD


Gold Ain't Looking So Hot After Today's Slam Down…

Looks like a HeadAndShoulders Threatening Formation ?


______________________________


March 12, 2020

#Gold has given back most of 2020's gains, still much better than the $SPX...


#Gold had a rough day along with the rest of the market.

That's still better than the S&P which HAS LOST TWO AND A HALF YEARS' WORTH OF GAINS IN LESS THAN ONE MONTH!!

March 2, 2020

#Gold's Slump Unlikely to Signal End of Rally


We've been here before.  In 2008 Gold dropped before marching higher to record $1920/oz three years later.


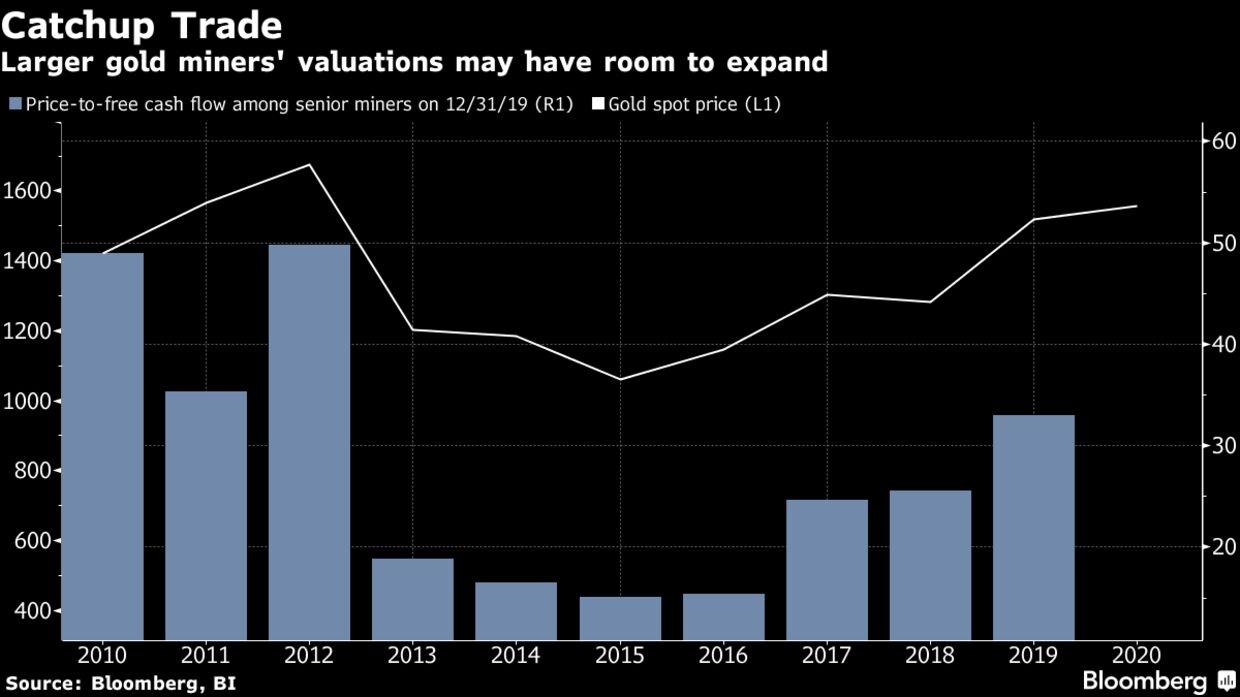
Gold fell a fifth in 2008, on its way to a record high.

Gold's Swoon Echoes Financial Crisis Blip

The conditions are still there for an extended rally.

In times of coronavirus panic, even havens can be unreliable.
Gold closed off February on a tarnished note, ending last week with its steepest daily decline since 2013. As financial markets panicked over the spread of the pneumonia-like illness, stocks tumbled and dragged gold and other precious metals lower. That's a rare phenomenon for a metal that tends to shine brighter when everything else looks gloomy. It will also be a brief one.

Back in 2008, spot gold fell by more than a quarter between July and late October, before embarking on an unprecedented run toward $1,900 an ounce, once global rate cuts began in earnest.

#Gold recovering from Friday’s sell-off this AM. #MasterMetals #Charts $GLD

#Gold trading Back above $1600/oz.

bit.ly/MasterMetalsCharts … $GLD
____________________________________________________
MasterMetals
@MasterMetals

February 28, 2020

February 6, 2020

As #Gold prices rose in 2019, investors jumped into #ETF’s | World @GoldCouncil


Gold Demand Trends Full year and Q4 2019 | World Gold Council
Huge rise in ETF inflows almost equalled the sharp drop in consumer demand in 2019


The net result was a marginal 1% decline in annual demand to 4,356t.

Global reserves grew by 650t – the second highest annual total.

Low/negative interest rates and geopolitical uncertainty fuelled this growth, while the gold price rally also attracted momentum-driven inflows.

Highlights

Annual gold demand in 2019 dips 1% to 4,355.7t

Total fourth quarter demand fell 19% y-o-y to 1,045.2t. Two main contributors to the y-o-y drop were jewellery and physical bar demand, both of which reacted to the elevated gold price. In US dollar value terms, the decline in Q4 demand was much shallower – down just 3% to US$49.7bn.
Inflows into global gold-backed ETFs and similar products pushed total holdings to a record year-end total of 2885.5t. Holdings grew by 401.1t over the year, with 26.8t added in Q4. Inflows were heavily concentrated in Q3 as the US dollar gold price rallied to a six-year high.
Central banks were net buyers for a 10th consecutive year: global reserves grew by 650.3t (-1% y-o-y), the second highest annual total for 50 years. Purchasing in Q4 of 109.6t was 34% lower y-o-y, although this was partly a reflection of the sheer scale of buying in 2018. 
China and India held sway over global consumer demand.

January 15, 2020

"Ratio of share price-to-free cash flow among senior #Gold #Miners...still hasn’t caught up to the gold price...more room to run" for #miningstocks $GDX $GLD

Larger gold miners' valuations may have room to expand


"The price increase, combined with capital discipline among the larger miners, is generating a bonanza of free cash flow while mergers could spark share gains among smaller players, according to five precious metals fund managers interviewed by Bloomberg.

"After more than $20 billion in mergers and acquisitions among large-cap miners last year, small and medium-sized companies could be next, providing another reason to buy."


____________________________________________________

MasterMetals
@MasterMetals

January 12, 2020

#Gold & #Silver Bull Market Full Steam Ahead- even with the latest pullback!

This was originally set to be published on Jan. 6, 2020

Happy Golden New Year to All!!  May the wind be at your back! 

Due to New Year holidays Net Commitments of Gold and Silver Traders and the KITCO Gold Survey were not published. The statistics of the Christmas week were published and showed large speculators were increasing their long positions and commercial dealers expanding their short positions.

January 1, 2020

#Gold #ETF's (Canada & US) 2019 Performance $GDX $XGD.to


XGD +39.88%
GDX +39.79% 

#Gold was a stealthy performer during 2019. Although there was not a full fledged Bull Market all-around, some of the Gold Mining equities did handsomely well. 


October 25, 2019

#Gold Closes above $1500/oz for the week $GLD $GDX $GDXJ

Time to buy, don’t get left out. 

Looking good breaking out of the flag


Ditto on The ETF


Same for the Gold Mining Stocks. 

___________________________________________________

MasterMetals
@MasterMetals

October 10, 2019

#Gold - Looking ready for the next leg up


Attached is the gold futures contract chart(nearest month - December).

The MACD turned down in early September (blue line crossing red line) and signaled a consolidation. Now the blue line is setting up for a golden cross with  the red line on the upside.

The gold market has tested several times just under the US$1'500 level, but the selling was never able to depress the gold price under that level more than a few days.

Trading programs are showing gold has entered into a positive cycle till at least year-end.

ShareThis

MasterMetals’ Tweets