Subscribe to MasterMetals
Search This Blog
April 14, 2025
April 9, 2025
Gold Just Had Its Best Day Since 2023
Market Updates
News
Gold prices, which had tumbled from record highs over the past week, reversed course and rose roughly 3% today, the biggest percentage jump since October 2023.
Spot gold was up 3.4% at $3,085.50/ounce. At $88.10 a troy ounce, gold futures' daily gain was the precious metal's largest in dollar terms since March 24, 2020, when markets were being convulsed by Covid lockdown orders and investors were fleeing into the haven asset.
Today's move came amid a bond market rout overnight and in the morning, followed by a historic surge in stock prices in the afternoon after President Trump’s reversal authorizing a 90-day pause on new tariffs for many countries—except for China which got hit with a 125% rate, effective immediately.
Silver gained 3.1% to $30.80/oz., Platinum slipped 1.2% to $931.87, and Palladium was up 1.9% at $923.75
U.S.-listed shares of South African miners: Gold Fields GFI up 7.5%, AngloGold Ashanti
AU rises 8.9%, Harmony Gold
HAR jumps 13.8% and Sibanye Stillwater SW.N> soars nearly 19%
Shares of Canadian miners: Kinross Gold K and Agnico Eagle Mines
AEM up 7.6% and 4.5%, respectively.
July 8, 2021
#Gold - #GoldenCross at hand?
This is called a golden cross. The golden cross is a technical chart pattern indicating the potential for a major rally.
The MACD (lower chart) is very oversold and crossing the red line. This supports higher prices. The Relative Strength (RSI) (upper chart) is also pointing higher.
There's a feeling that the gold price is currently being held back by silver prices, as the July silver futures contract is in the delivery month and the open interest, which is high, indicates holders of the contracts are demanding delivery. 😥
May 17, 2021
#GOLD: Getting ready to break out —UPDATED! $GLD

June 22, 2020
Will #Gold #miners struggle to maintain 2019 production levels?

Prior to the coronavirus outbreak, peak gold supply was becoming a real possibility. Now, with exploration programs halted or cancelled and project disruptions hampering production, will Gold miners struggle to maintain 2019 production levels, as Wood Mac says?
May 18, 2020
Is #Gold Setting Itself Up For A Fall? #HeadAndShoulders? $GLD
March 12, 2020
#Gold has given back most of 2020's gains, still much better than the $SPX...
March 4, 2020
After the Fed's 0.50% rate cut, #Gold remains strong.
bit.ly/MasterMetalsCharts
____________________________________________________
MasterMetals
@MasterMetals
March 2, 2020
#Gold's Slump Unlikely to Signal End of Rally

We've been here before. In 2008 Gold dropped before marching higher to record $1920/oz three years later.
Gold's Swoon Echoes Financial Crisis Blip
The conditions are still there for an extended rally.
In times of coronavirus panic, even havens can be unreliable.
Gold closed off February on a tarnished note, ending last week with its steepest daily decline since 2013. As financial markets panicked over the spread of the pneumonia-like illness, stocks tumbled and dragged gold and other precious metals lower. That's a rare phenomenon for a metal that tends to shine brighter when everything else looks gloomy. It will also be a brief one.
Back in 2008, spot gold fell by more than a quarter between July and late October, before embarking on an unprecedented run toward $1,900 an ounce, once global rate cuts began in earnest.
#Gold recovering from Friday’s sell-off this AM. #MasterMetals #Charts $GLD
bit.ly/MasterMetalsCharts … $GLD
____________________________________________________
MasterMetals
@MasterMetals
February 28, 2020
#Gold getting slammed.
bit.ly/MasterMetalsCharts
#B2Gold Reports Strong Fourth Quarter and Full-Year 2019 Results and Record 2019 Annual #Gold Production of 980,219 Oz; Declares Dividend for First Quarter 2020
February 6, 2020
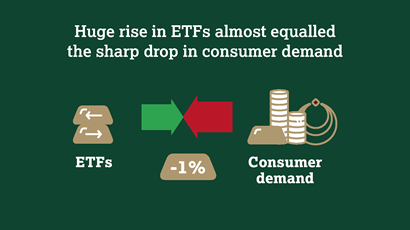
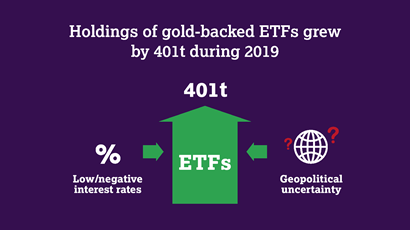
As #Gold prices rose in 2019, investors jumped into #ETF’s | World @GoldCouncil
Highlights
Annual gold demand in 2019 dips 1% to 4,355.7t
January 15, 2020
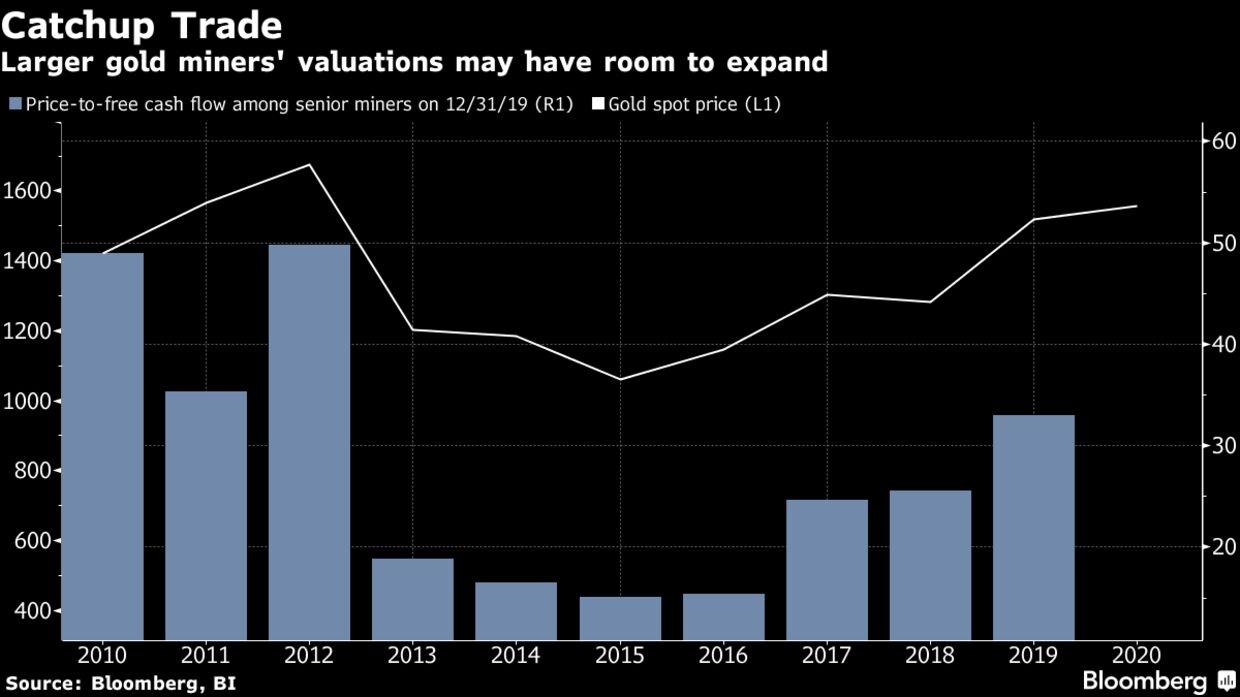
"Ratio of share price-to-free cash flow among senior #Gold #Miners...still hasn’t caught up to the gold price...more room to run" for #miningstocks $GDX $GLD

MasterMetals
@MasterMetals
ShareThis
MasterMetals’ Tweets
- #Silver: iShares Silver Trust $SLV DOWN 0.9187%! Last at $29.12 on May 2, 2025 at 02:00AM. https://bit.ly/2uOmXzN https://bit.ly/42X1ssl - 5/2/2025
- “Copper is not incompatible with Wine” Argentina’s Mendoza Governor giving his support to Mining in the province. https://bit.ly/3GDHr2Q - 5/2/2025
- #Gold: SPDR Gold Shares ETF $GLD dropped by 2.0706%! Last at 297.48 #MasterMetals #GLD https://bit.ly/39s7ZgS https://bit.ly/4cW8WAu - 5/1/2025
- #Silver: iShares Silver Trust $SLV DOWN 0.6926%! Last at $29.395 on May 1, 2025 at 02:00AM. https://bit.ly/2uOmXzN https://bit.ly/4m2YP1c - 5/1/2025
- VANECK JUNIOR GOLD MINERS ETF $GDXJ UP 1.2366%! Last at 61.4. #Gold #MiningStocks #GDXJ #ETF #MasterMetals https://bit.ly/39s7ZgS https://bit.ly/4d2Ozls - 4/30/2025
- Golden Start of the Year - 5/1/2025
- $BHP - Q3 2025 Activities Report - 4/17/2025
- Trump & Metals - 4/16/2025
- Gold Miners (Finally) Performing - 4/15/2025
- Gold Just Had Its Best Day Since 2023 - 4/10/2025


