Search This Blog

May 25, 2018

#Mining: #Digital solutions are being adopted, but usually as point solutions in the value chain rather than as a holistic approach

EY - Digital mining: the next wave of transformation - EY - Global

EY's latest report: Given that digital has become a key enabler of margin improvement and enhancer of competitiveness in the sector, it is critical that [Mining] organizations develop a clear approach to bridging the disconnect between the potential of and the successful delivery from digital transformation.


https://www.ey.com/gl/en/industries/mining---metals/ey-digital-in-mining-and-metals

Improving digital effectiveness

Digital effectivenessDigital wave approachDigital NavigatorFAQsRelated insightsContacts

Digital effectiveness is the top risk facing the mining and metals sector, with the growing disconnect between the potential of and the successful delivery from digital transformation. Given that digital has become a key enabler of margin improvement and enhancer of competitiveness in the sector, it is critical that organizations develop a clear approach to bridging the disconnect.

Digital solutions are being adopted, but usually as point solutions in the value chain rather than as a holistic approach as discussed in our paper, "How do you prepare for tomorrow's mine today?" Point solutions will not get us to the next level of productivity improvement or enhance end-to-end decision-making.

The collective impact of these challenges can result in a tentative approach to strategy — reflected by small, disconnected initiatives — rather than a strong commitment to a multi-year transformation approach.

EY's digital wave approach to transformation

We have identified a pragmatic and effective approach to transitioning your business from its current state towards an improved future state. This is to create a clear pathway for transformation, specifically described as "The digital wave transformation approach." It meets the need of having an active, progressive and compelling digital strategy, while also recognizing the issues associated with business risk and maintaining a coherent program of work.

Our approach is like a series of waves moving through the organization, steadily introducing more digital hotspots and interconnections, all within a coherent overarching strategy.

This wave approach to digital transformation contains four main components – Pre-start, Wave 1, Wave 2 and Wave 3.

Click on each component to know more:

EY's digital wave approach to transformation

The process of launching waves is not necessarily sequential. For example, high-value areas with a close link to productivity may move from Wave 1 to Wave 2 before initial work has commenced in areas with less-compelling business cases.

Market leadership can quickly be lost if dominant players respond slowly or ineffectively to industry disruption and external changes. The pathway through the waves cannot be viewed as static, sequential or "set and forget." We see the end-state vision as constantly changing and businesses will need to be ready to adapt and change course as required."

Paul Mitchell, Global Mining & Metals Advisory Leader

EY's Digital Navigator

Leaders in the sector understand the compelling case for change, but are looking for the right way to go about the transformation without falling into various pitfalls that cause many change initiatives to fail. It is not a question of when to go digital; it is about how to start thinking of a fully integrated business culture shift, and that really needs leadership focus.

We can support your business through the use of the Digital Navigator — an approach and toolkit that supports EY to assess a company's digital maturity and help create an actionable digital road map for our clients based on linking current capability and existing investments with business ambition and strategy.

Our approach and toolkit has three phases:

Using the Digital Navigator together with the Process in Mining Enterprises (PRIME) model — to assess and map digital solutions against the most critical areas of the mining value chain — aids effective prioritization of solutions and alignment for maximum release of value over time. 

See the whole report here: https://www.ey.com/gl/en/industries/mining---metals/ey-digital-in-mining-and-metals


May 18, 2018

#Lithium Cartel: The emerging oligopoly in key #battery element #EV $ALB $SQM

The Lithium Cartel Should Be Stopped

#Tianqi Lithium Corp. will pay $4.1 billion to buy Nutrien Ltd.'s 24 percent stake in Soc. Quimica & Minera de Chile SA, or SQM, in a deal that will entangle the biggest and fourth-biggest producers of the battery metal. The transaction could theoretically give Tianqi half of the board seats


https://www.bloomberg.com/amp/view/articles/2018-05-18/time-to-block-the-lithium-cartel?__twitter_impression=true


The Lithium Cartel Should Be Stopped

Why are we so relaxed about an emerging oligopoly in the key battery element?


The stuff of lithium dreams in Chile.
Photographer: Michael Smith/Bloomberg

The world doesn't like its essential commodities being controlled by a small group of producers.
So why is there so little noise about the emerging oligopoly in one of the hottest elements on the periodic table, lithium?


Tianqi Lithium Corp. will pay $4.1 billion to buy Nutrien Ltd.'s 24 percent stake in Soc. Quimica & Minera de Chile SA, or SQM, in a deal that will entangle the biggest and fourth-biggest producers of the battery metal. The transaction could theoretically give Tianqi half of the board seatsThe transaction could theoretically give Tianqi half of the board seats, though other major shareholders who've historically guarded their interests have opposed such a path.
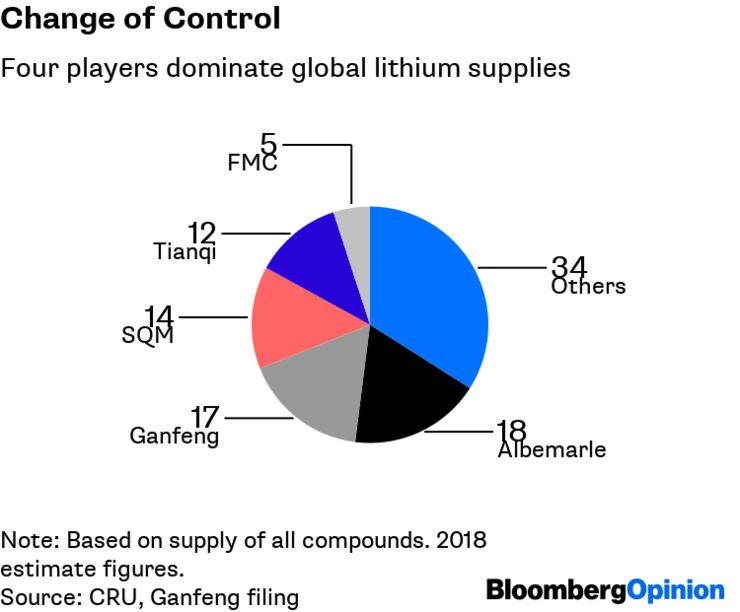
Here's how the lithium carbonate market is structured at present: North Carolina-based Albemarle Corp. is the market leader, with an 18 percent share, followed by Jiangxi Ganfeng Lithium Co. on 17 percent; SQM on 14 percent; and Tianqi on 12 percent. Other players have the 39 percent or so that remains — the largest among them being FMC Corp., which is soon to offer its shares to whoever wants them in a planned initial public offering.

#BatteryMetals: #EV Electric Vehicle Forecast Through 2050 & Primer @RBC

By 2025, we see ~7.5% BEV global penetration of new demand representing a ~34% CAGR from 2017's levels and ~12% HEV/PHEV penetration representing a ~21% CAGR. 

By 2025, we see BEV penetration in China at ~15%, Western Europe at ~8% and the US at 5%. Our ~7.5% global BEV penetration rate compares to IHS at ~5%.

Battery EVs will represent ~35% of global VIO by 2050


RBC Electric Vehicle Forecast Through 2050 & Primer

We've picked up a noticeable increase in the amount of electrification conversations among industry participants and an acceleration in investor expectations for the pace of electric vehicle penetration. With that in mind, we took a fresh look at our electric vehicle forecast, out through 2050, and present a primer on electric vehicles and how different industry participants are preparing for the future.

Forecast global BEV sales penetration of ~7.5% by 2025
We estimate that globally, battery electric vehicles (BEVs) represented ~0.8% of 2017 global demand, while hybrid-electric vehicles (HEVs) and plug-in hybrid-electric vehicles (PHEVs) represented ~2.9%. But we see robust growth off these low figures. The growth will be driven in two phases. The first phase, through 2025, is primarily regulatory driven. By then, we see ~7.5% BEV global penetration of new demand representing a ~34% CAGR from 2017's levels and ~12% HEV/PHEV penetration representing a ~21% CAGR. By 2025, we see BEV penetration in China at ~15%, Western Europe at ~8% and the US at 5%. Our ~7.5% global BEV penetration rate compares to IHS at ~5%.

Forecast global BEV sales penetration of ~66% by 2050
In the second phase, we see change factors aligning to impart more significant revolution. Battery costs decline, infrastructure is built out, and the regulatory-driven push gives way to a consumer-led one. BEVs become more cost efficient than ICE vehicles and take share from HEV/PHEV. By 2050, we see ~66% BEV global new vehicle penetration, representing a ~9% CAGR over a 25-year period from 2025. We see regions like China and Western Europe reaching 85% penetration. We forecast the US at 60% penetration.

BEVs will represent ~35% of global VIO by 2050
Our modeling shows that for global vehicles in operation (VIO) by 2025, ~91% will be ICE, ~3% 48V, ~4% HEV/PHEV (so ~98% still have some sort of ICE), and ~2% BEV. By 2050, we model the global VIO to be ~49% ICE, ~8% 48V, ~8% HEV/PHEV (so vehicles having some sort of ICE down to ~65%), and ~35% BEV. Please see regional analyses inside and ask your RBC salesperson for our EV model.

What it means for automakers?
Automakers are accelerating electrification efforts. R&D increases, limiting profits today. But electrification is also an opportunity to rethink production/supply chains/capability, which may represent an opportunity for OEMs to re-capture value. German OEMs doing the most. GM ahead of Ford to-date but Ford spending to catch up. Tesla increasingly competes on attributes besides electrification.

What it means for suppliers?
For ICE/exhaust products, expect margin pressure driven by lower volumes. Ultimately, we see the need for powertrain consolidation. There are opportunities for evolution and new parts such as batteries, electric motors, and power electronics come into vehicles. But evolution means investment now. Suppliers may look to JVs to fill competency gaps. Interim solutions such as 48-volt technology can be a strong growth opportunity (41% CAGR through 2025) for companies like BWA, DLPH and LEA. However, the majority of future electrified platforms likely PHEV/BEVs creating opportunities to add value from motors (BWA) and power electronics (DLPH, BWA). Meanwhile, axle makers (AXL, DAN, MTOR) may have an underappreciated opportunity to grab more value.

Will EVs make China an automotive powerhouse?
EVs present a significant opportunity for China to assert itself within the automotive industry. Our view is informed by: 1) a government that is very supportive of EVs; 2) Chinese companies pushing EV product; 3) China appears to control a large portion of battery supply...; 4) ...and the battery supply chain.


ShareThis

MasterMetals’ Tweets