Search This Blog

May 18, 2018

#Lithium Cartel: The emerging oligopoly in key #battery element #EV $ALB $SQM

The Lithium Cartel Should Be Stopped

#Tianqi Lithium Corp. will pay $4.1 billion to buy Nutrien Ltd.'s 24 percent stake in Soc. Quimica & Minera de Chile SA, or SQM, in a deal that will entangle the biggest and fourth-biggest producers of the battery metal. The transaction could theoretically give Tianqi half of the board seats


https://www.bloomberg.com/amp/view/articles/2018-05-18/time-to-block-the-lithium-cartel?__twitter_impression=true


The Lithium Cartel Should Be Stopped

Why are we so relaxed about an emerging oligopoly in the key battery element?


The stuff of lithium dreams in Chile.
Photographer: Michael Smith/Bloomberg

The world doesn't like its essential commodities being controlled by a small group of producers.
So why is there so little noise about the emerging oligopoly in one of the hottest elements on the periodic table, lithium?


Tianqi Lithium Corp. will pay $4.1 billion to buy Nutrien Ltd.'s 24 percent stake in Soc. Quimica & Minera de Chile SA, or SQM, in a deal that will entangle the biggest and fourth-biggest producers of the battery metal. The transaction could theoretically give Tianqi half of the board seatsThe transaction could theoretically give Tianqi half of the board seats, though other major shareholders who've historically guarded their interests have opposed such a path.
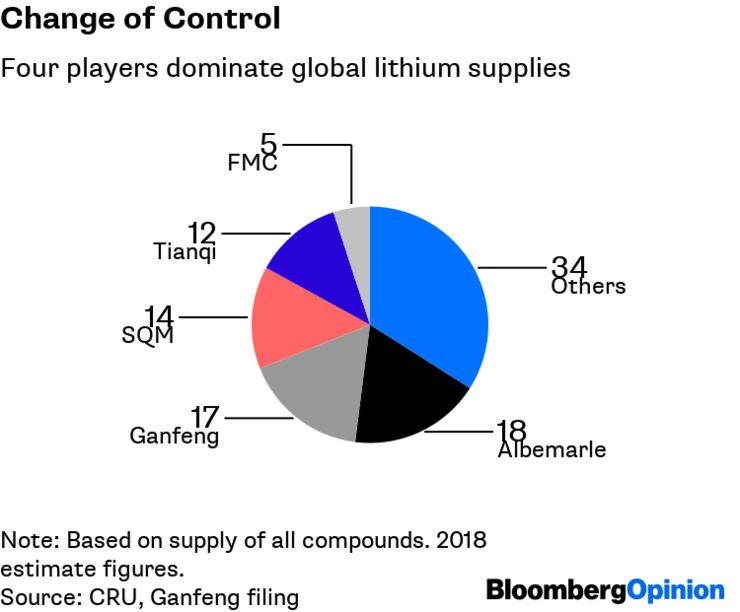
Here's how the lithium carbonate market is structured at present: North Carolina-based Albemarle Corp. is the market leader, with an 18 percent share, followed by Jiangxi Ganfeng Lithium Co. on 17 percent; SQM on 14 percent; and Tianqi on 12 percent. Other players have the 39 percent or so that remains — the largest among them being FMC Corp., which is soon to offer its shares to whoever wants them in a planned initial public offering.

#BatteryMetals: #EV Electric Vehicle Forecast Through 2050 & Primer @RBC

By 2025, we see ~7.5% BEV global penetration of new demand representing a ~34% CAGR from 2017's levels and ~12% HEV/PHEV penetration representing a ~21% CAGR. 

By 2025, we see BEV penetration in China at ~15%, Western Europe at ~8% and the US at 5%. Our ~7.5% global BEV penetration rate compares to IHS at ~5%.

Battery EVs will represent ~35% of global VIO by 2050


RBC Electric Vehicle Forecast Through 2050 & Primer

We've picked up a noticeable increase in the amount of electrification conversations among industry participants and an acceleration in investor expectations for the pace of electric vehicle penetration. With that in mind, we took a fresh look at our electric vehicle forecast, out through 2050, and present a primer on electric vehicles and how different industry participants are preparing for the future.

Forecast global BEV sales penetration of ~7.5% by 2025
We estimate that globally, battery electric vehicles (BEVs) represented ~0.8% of 2017 global demand, while hybrid-electric vehicles (HEVs) and plug-in hybrid-electric vehicles (PHEVs) represented ~2.9%. But we see robust growth off these low figures. The growth will be driven in two phases. The first phase, through 2025, is primarily regulatory driven. By then, we see ~7.5% BEV global penetration of new demand representing a ~34% CAGR from 2017's levels and ~12% HEV/PHEV penetration representing a ~21% CAGR. By 2025, we see BEV penetration in China at ~15%, Western Europe at ~8% and the US at 5%. Our ~7.5% global BEV penetration rate compares to IHS at ~5%.

Forecast global BEV sales penetration of ~66% by 2050
In the second phase, we see change factors aligning to impart more significant revolution. Battery costs decline, infrastructure is built out, and the regulatory-driven push gives way to a consumer-led one. BEVs become more cost efficient than ICE vehicles and take share from HEV/PHEV. By 2050, we see ~66% BEV global new vehicle penetration, representing a ~9% CAGR over a 25-year period from 2025. We see regions like China and Western Europe reaching 85% penetration. We forecast the US at 60% penetration.

BEVs will represent ~35% of global VIO by 2050
Our modeling shows that for global vehicles in operation (VIO) by 2025, ~91% will be ICE, ~3% 48V, ~4% HEV/PHEV (so ~98% still have some sort of ICE), and ~2% BEV. By 2050, we model the global VIO to be ~49% ICE, ~8% 48V, ~8% HEV/PHEV (so vehicles having some sort of ICE down to ~65%), and ~35% BEV. Please see regional analyses inside and ask your RBC salesperson for our EV model.

What it means for automakers?
Automakers are accelerating electrification efforts. R&D increases, limiting profits today. But electrification is also an opportunity to rethink production/supply chains/capability, which may represent an opportunity for OEMs to re-capture value. German OEMs doing the most. GM ahead of Ford to-date but Ford spending to catch up. Tesla increasingly competes on attributes besides electrification.

What it means for suppliers?
For ICE/exhaust products, expect margin pressure driven by lower volumes. Ultimately, we see the need for powertrain consolidation. There are opportunities for evolution and new parts such as batteries, electric motors, and power electronics come into vehicles. But evolution means investment now. Suppliers may look to JVs to fill competency gaps. Interim solutions such as 48-volt technology can be a strong growth opportunity (41% CAGR through 2025) for companies like BWA, DLPH and LEA. However, the majority of future electrified platforms likely PHEV/BEVs creating opportunities to add value from motors (BWA) and power electronics (DLPH, BWA). Meanwhile, axle makers (AXL, DAN, MTOR) may have an underappreciated opportunity to grab more value.

Will EVs make China an automotive powerhouse?
EVs present a significant opportunity for China to assert itself within the automotive industry. Our view is informed by: 1) a government that is very supportive of EVs; 2) Chinese companies pushing EV product; 3) China appears to control a large portion of battery supply...; 4) ...and the battery supply chain.
 

April 30, 2018

$DGC #DetourGold crashes as costs increase #Gold

Review of operating costs showed the 2017 plan to be too optimistic, and the company has guided that overall LoM total site costs are likely to increase 8–14%, to $810–$850/oz. …the mining cost has hovered around C$3.00/tonne, even as the mining rate increased from 210Ktpd to 300Ktpd over the last few years. The economies of scale have not materialized, and despite spreading the fixed costs over more tones, the variable cost increases negated that decrease. 

This is paradigm capital's note:

Cost Pressures Overshadow Near-Term Production Increases in LoM Plan Review
Investment Thesis. Detour Gold is an Intermediate gold producer with the flagship Detour Lake mine in northern Ontario. We view the mine as a world-class asset with annual gold production expected to be in the 550–700Koz range for 20+ years. Due to the nature of the orebody there are some years of lower profitability in the near-term, and we believe the long-term value of the world-class asset and years of stronger profitability longer-term is not fully recognized.

Event
Detour released its Q1/18 financials and the preliminary results of a review of an updated life-of-mine (LoM) plan for the Detour Lake operations on Thursday and held an Analyst Workshop on Friday. While Detour was successful in identifying opportunities to increase production in 2019–2020, this was overshadowed by a review of operating costs suggesting permanent increases to the estimates provided in last year's LoM plan.
Highlights
 Q1 Results Buoyed by Grade, but 2018 Guidance Downgraded

ShareThis

MasterMetals’ Tweets