Search This Blog

September 13, 2018

#Mining #exploration spending in #Australia jumps to $563.4MM, 5-year high

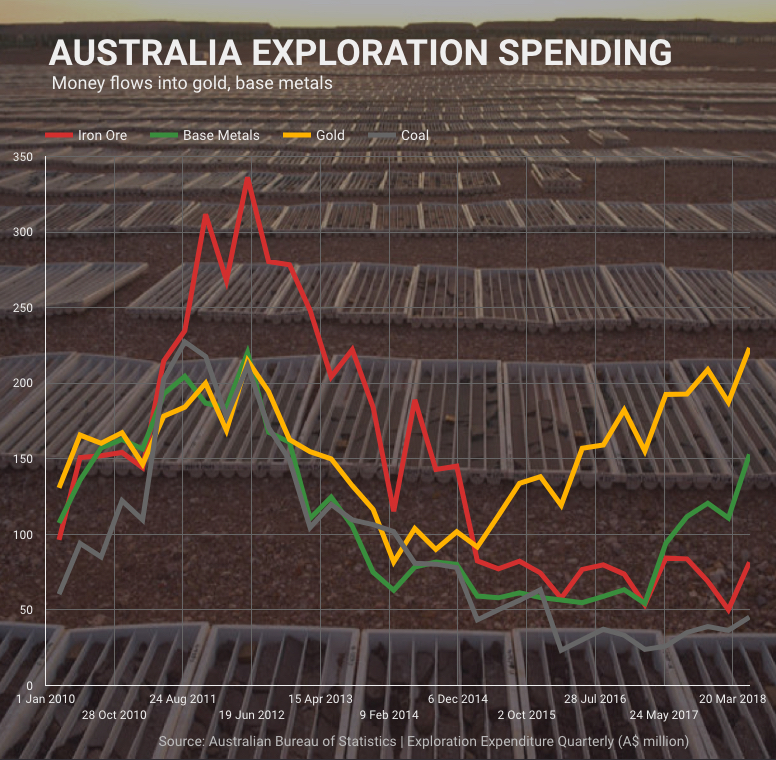
#Gold exploration at $223m highest since the second quarter of 1997. The June quarter also exceeded spending in the second half of 2011 when gold prices reached all-time highs above $1,900 an ounce

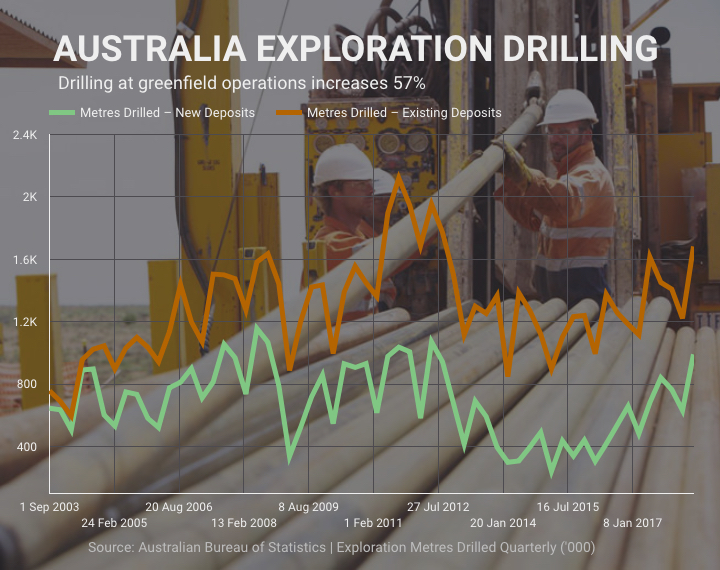
Total number of meters of drilling on new deposits highest in six years and more than triple the total for the first quarter of 2016, the low of the market


Mining exploration spending in Australia jumps to 5-year high

ThankGraph background image: Strike Drilling

Australia is the world's number two gold producer; the country's tightening its grip on the trade in iron ore and coking coal; comes in at no 6 for copper; and is set to increase output of mineral-du-jour lithium from the current 38% to nearly half the global total within five years.

That's the result not only of a rich mineral endowment but massive amounts of money spent on exploration across the continent.

After a sharp drop-off when it became clear that boom times for Chinese economic growth were beginning to taper, new data from the Australian Bureau of Statistics shows the country's miners and explorers are once again pouring money into the sector.
Mining exploration spending in Australia jumps to 5-year high - spending on gold copper

Graph background image: OZ Minerals

ABS announced this week the country's mineral exploration expenditure jumped by 26.6% during the second quarter compared to last year to total $563.4m. That's the highest level since the third quarter of 2013.

Spending on base metals rose at the fastest pace, up 38%, to the highest since the final quarter of 2012. Iron ore exploration also appears to be escaping the doldrums after two quarters of sequential growth (although nothing close to spending from 2011 to 2014 when iron ore was worth double it is now).

Most striking is the amount of money chasing gold. Spending on gold exploration at $223m was the highest since the second quarter of 1997. The June quarter also exceeded spending in the second half of 2011 when gold prices reached all-time highs above $1,900 an ounce.
Mining exploration spending in Australia jumps to 5-year high - drilling at new projects

Graph background image: OZ Minerals

Although smaller in absolute terms, greenfield capex is back in focus with investment in exploration on new deposits rising 37% to $54m during the June quarter compared to 24% more spent on expanding existing resources ($70.7m).

A total of 2.57 million metres were drilled during the quarter, up a whopping 44.3% year on year. Here the focus on new discoveries was even more evident with drills at new deposits working much harder – up 57% to just shy of 1m metres – versus at existing deposits which rose by 38%.

The total number of metres of drilling on new deposits was the highest in six years and more than triple the total for the first quarter of 2016, when metals and mineral markets started to bottom. Holes drilled at greenfield projects as a proportion of overall metres was the highest since 2010, ABS data show.

Encouraging for the Australian industry is that spending is much better spread across sectors compared to the height of the China-induced supercycle in commodity demand.

During the go-go years spending topped $1 billion during two quarters – the final quarter of 2011 and the second quarter of 2012.

But during that period coal and iron made up 51% of total exploration spending. The most recent figures show the share of Australia's top export earners falling to 22% of the total.

http://www.mining.com/mining-exploration-spending-australia-jumps-5-year-high/

August 8, 2018

July 4, 2018

#Nickel - #Battery grade material Sees a Price difference emerging due to potential nickel demand for #EV’s

@Scotiabank new report:  "Is The Nickel Market On Its Way to Becoming Bifurcated? Why Understanding Class I, Class II (and the EV Context) Matters…."


Attachment 1 shows the 1-year spot price of nickel and attachment 2 the 1-year LME nickel warehouse stocks level.


Below is a comment from Scotiabank how the nickel price has been rising on potential battery demand for electric vehicles (EV's).


"Is The Nickel Market On Its Way to Becoming Bifurcated? Why Understanding Class I, Class II (and the EV Context) Matters….: In line with the definition provided by the International Nickel Study Group (INSG), refined nickel (class I) includes products such as electrolytic nickel, pellets, briquettes, granulates, rondelles, or powder/flakes with a nickel content of at least 99%. Charge nickel (class II) includes products such as ferro-nickel, nickel oxide, utility nickel, or nickel pig iron (NPI) with a nickel content below 99%. Recall that the difference between the two classes of nickel was recently highlighted by VALE given the company's current frustration in its inability to fully capture the premium for all the class I nickel it produces, because a portion of its higher quality class I output (and class I suitable for batteries) had been being sold to produce stainless steel. Unsurprisingly, VALE is making changes internally to change this and capture more value….


So, Is there a Shortage of (Class I) Nickel for Batteries? Not for a while in Scotia's view. The growing widespread adoption of electric vehicles (EV) in both the Western World and in China has created significant attention and investor interest in several EV inputs including cobalt, nickel, lithium, and copper. While EV demand for nickel currently represents only a minor ~3% of the market, demand is anticipated to materially increase over the next decade. Although growing non-stainless demand is a very positive long-term backdrop for the market, we do not see a looming near-term supply crunch for nickel. Global nickel inventories, while substantially improved (ie. drawn down) from 2016 levels, still  remain at historically elevated levels. Looking at visible inventories at a more in-depth level, Scotiabank Senior Base Metals Analyst Orest Wowkodaw notes that there are currently 261,000 tonnes of Class I nickel briquettes sitting in LME warehouses, representing 78% of total LME inventories. Conservatively assuming 100% of the nickel stored in Shanghai and in Chinese bonded warehouses is cathode, briquettes represent ~60% of global nickel inventories. The stainless steel industry consumes primarily nickel cathodes but also nickel briquettes, while the non-stainless sector (including batteries) consumes primarily briquettes. In 2018, Orest forecasts only 31% of nickel demand from the non-stainless sector. While he forecasts this consumption mix to only slightly increase to 35% non-stainless by 2022, he anticipates the size of the overall nickel market to increase by 239,000 tonnes or by 11% during this five-year period. On a more positive note, Orest continue to see a looming shortage for Class I nickel developing next decade as EV demand accelerates during a very long period where prices to develop new greenfield nickel supply remains below incentive levels. In his view, the viable greenfield project pipeline for future Class I nickel supply appears bleak. Furthermore, the appetite to develop another large scale multi-billion dollar HPAL laterite project remains practically non-existent.


While current visible nickel stocks of 355kt (equal to 56 days of consumption) would suggest there is still plenty of available nickel in the market, the rate of YTD inventory decline has been markedly more pronounced than Orest had previously anticipated (he currently forecast year-end 2018 visible stocks of 373kt or 61 days and it's only June). A recent discussion with commodity consultants WoodMackenzie suggest that a large portion of these draw-downs could be attributed to speculative hoarding."


ShareThis

MasterMetals’ Tweets