Search This Blog

Showing posts with label Dollar. Show all posts

October 31, 2023

#China stands out as largest buyer of #gold this year


Central banks have bought 800 tonnes in first nine months of the year, up 14% year-on-year, according to a report by the World Gold Council 

Central banks in emerging markets look to reduce reliance on US dollar for reserves holdings

China has stood out as the largest purchaser of gold this year as part of a 11-month buying streak. The People’s Bank of China has reported snapping up

July 28, 2021

August 15, will mark the 50th Anniversary of when the US stopped pretending #Dollars were worth their weight in #Gold.


In a few weeks, August 15, we’ll be hitting the 50th Anniversary of when the US—and thus, the rest of the world— stopped pretending that #Dollars were worth their weight in #Gold. Its effects have since been felt across the board, as #USD’s Purchasing Power has steadily declined…

January 12, 2021

Share of #Gold in #Russian #CentralBank’s reserves beats US #Dollar holdings for first time ever

© Global Look Press
The gold share of Russia's foreign exchange holdings rose to 22.9 percent over the year to June 30, 2020, according to data revealed by the country's central bank.

At the same time, the share of US dollar shrank to 22.2 percent from 24.2 percent, while the share of the euro dropped to 29.5 percent from 30.6 percent. The regulator also decreased its holdings of Chinese yuan to 12.2 percent from 13.2 percent.

See the whole story online here: https://www.rt.com/business/512219-gold-dollar-russian-reserves/

________________________

October 15, 2020

The Case for #Gold. It’s Simply Math, says John Hathaway of Sprott

Sprott Gold Report: Gold, The Simple Math
Great piece from John Hathaway of Sprott 

Gold, The Simple Math

The current pullback in the precious metals sector is a buying opportunity. Since trading at a closing high of $2,064 an ounce on August 6, gold bullion has declined 8.34% as of this writing.1 Gold mining shares have followed suit, declining 9.26% since the August high.2 It is possible that gold and related mining shares could continue to chop sideways to lower until the U.S. presidential election results are known and even into yearend as the implications are sorted out. Whatever the electoral outcome, the path towards monetary debasement is bipartisan. It is crucial for investors to focus on the long-term trend and to avoid the distractions of short-term timing considerations.

The very strong investment fundamentals for gold and gold mining shares are based on what has been a slow irreversible drift towards significant U.S. dollar (USD) devaluation. Paper assets, including equities, bonds and currencies, have underperformed the dollar gold-price since 2000, the dawn of radical monetary experimentation by central bankers. Until recently, gold's strength has attracted little notice from mainstream investors. Widespread disinterest can perhaps be ascribed to the stealthy, long-term character of gold's outperformance. In addition, the absolute performance of equities and bonds has been positive over the past two decades, so there has been little incentive to look elsewhere.

Figure 1. Gold vs. Stocks, Bonds and USD
Relative Returns for Period from 12/31/1999-9/30/2020


Source: Bloomberg. Period from 12/31/1999-9/30/2020. Gold is measured by GOLDS Comdty Index; S&P 500 TR is measured by the SPX; US Agg Bond Index is measured by the Bloomberg Barclays US Agg Total Return Value Unhedged USD (LBUSTRUU Index); and the U.S. Dollar is measured by DXY Curncy. Past performance is no guarantee of future results. You cannot invest directly in an index.

Lack of Crowd Recognition Provides Opportunity

September 10, 2020

#Gold’s Performance Continues To Be Stellar With Returns of 20-32% Across All Major Currencies


As of the beginning of September, #Gold is up by a wide margin vs. all other asset classes. 


In USD +28%; GBP +30%. Even against the Mighty Swissy up +20%!

Gold Price Performance in USD, EUR, GBP, CHF, JPY, AUD, CAD, CNY, INR, continues to Outperform vs. all major stock markets. 

See the Gold Price Performance Page

January 12, 2020

#Gold & #Silver Bull Market Full Steam Ahead- even with the latest pullback!

This was originally set to be published on Jan. 6, 2020

Happy Golden New Year to All!!  May the wind be at your back! 

Due to New Year holidays Net Commitments of Gold and Silver Traders and the KITCO Gold Survey were not published. The statistics of the Christmas week were published and showed large speculators were increasing their long positions and commercial dealers expanding their short positions.

December 15, 2019

The World’s Wealthy Are Hoarding #Gold - Physical not #ETF‘s

At least that's what Goldman Sachs says...
The Wealthy Are Hoarding Physical Gold
The world's rich are hoarding gold – this according to data buried in a recent Goldman Sachs note to clients.
In the note published over the weekend, Goldman recommended diversifying long-term bond holdings with gold, citing "fear-driven demand" for the yellow metal.


The Goldman note cited political uncertainty and recession fears as the catalyst for the move toward gold. It also mentioned worries about a wealth tax, increasing interest in Modern Monetary Theory (essentially money-printing) and the current loose central bank monetary policy.
Data buried in the note also revealed that owning physical gold appears to be the preferred method to "hedge against tail events" by the rich.
"Since the end of 2016 the implied build in non-transparent gold investment has been much larger than the build in visible gold ETFs."

August 6, 2019

#Gold Prices Hitting All-Time Highs In #GBP, #JPY, #CAD, #AUD

"If I had money in the bank, I [would] sell the dollars and use that money to buy gold. You are divesting yourself from your currency by selling it and buying a hard asset. People are concerned," said RJO Futures senior market strategist Phillip Streible.
Spot gold in British pounds rallied 2.04% on the day, hitting above GBP £1,208 an ounce during the North American trading session, according to Kitco's aggregated charts.
"There is a lot of risk with the British pound right now. The EU would be the first to go into a complete recession, followed by the British pound," Streible pointed out.
Gold in Japanese yen hit a record high on Monday as well with spot prices jumping more than 1.3% on the day at last trading at JPY ¥155,550.

April 29, 2019

#Venezuela-#Turkey #Gold for Food Trading Scheme hides many stories


Retrofitted criminal networks are being used to trade gold for the subsidized food rations that's propping up the regime.

Good piece from Bloomberg on the criminal alliance between the new best friends, Venezuela's Maduro and Turkey's Erdogan-and the ColombianLebanese raking in the billions along the way... As They say, My Enemy's Enemy, is My Friend...
"With the coup attempt," Erdogan said at a news conference earlier this year, "we met Maduro. It has been a good beginning."


relates to Venezuela's Trade Scheme With Turkey Is Enriching a Mysterious Maduro Crony
Maduro and Erdogan in Istanbul in October 2016.
Photographer: Kayhan Ozer/Anadolu Agency/Getty Images

Within weeks of the July call, Maduro announced his first trip to Turkey. Before the end of 2016, that Turkish Airlines route between Istanbul and Caracas was inaugurated, and delegations from the two countries started crisscrossing the Atlantic to forge deals. They began to construct a secretive business network, one that could operate out of reach of financial sanctions imposed by the U.S. It would be a network that trades in two powerful currencies for Venezuela: gold and food.
Maduro was saddled with a near-worthless currency, the bolĂ­var, that had been bludgeoned by years of hyperinflation. Profits from his country's massive oil reserves, which had funded the Venezuelan government for decades, were evaporating because of falling prices, a neglected and crumbling infrastructure, rampant corruption, and international isolation. Venezuelans were starving, and Maduro's approval rating had plummeted. So he grasped a financial lifeline in gold, one of the only resources of value he had left.
In August 2016, Maduro announced that a state mining company called Minerven would be the sole official gold buyer in the vast tracts of jungle, savanna, and rolling hills where mining had long been clandestine and unregulated—essentially legalizing a business lorded over by murderous gangs. He sent in troops to force miners to comply and began hoovering up ore from open-pit mines. (Through a spokesman, Victor Cano, the mining minister, declined to comment for this story.) Maduro also started cashing in on the billions of dollars' worth of gold bars that ChĂ¡vez, who was loath to invest in U.S. dollars, had stockpiled. The sell-off carried hints of desperation. According to sources in Venezuela's central bank, the government secretly sold the bank's massive collection of rare gold coins, dating to the 18th century. The coins, box upon box of them, were thrown together in a single 30-ton sale in late 2017, and Venezuela accepted a price based on their weight alone, not their collectible value.

March 25, 2016

#Gold and #goldstocks - Uptrend stopped


Gold and gold stocks - Uptrend stopped

Attached are the daily charts of  North American largest gold companies, Barrick Gold and Newmont Mining. Both broke yesterday on the downside from an uptrend which was in place since the middle of  January 2016. The MACD gave a signal of divergence since early March which requested extreme caution.

The gold chart (attachment 2) completed yesterday a Head&Shoulder formation with a neckline just under US$ 1,240 per ounce.

The good thing is that we were warned for the last 2-3 weeks with the divergence of the gold price and the MACD that something is wrong. Very seldom we get such a nice pre warning in advance and investors were able to take the necessary action.

We don't take serious the usual excuse it was all about  a strong dollar. As attachment 4 shows, the U.S. Dollar Index is still in a well defined box with no indication of a strong move on the upside or on the downside at the moment.

Happy Easter

February 10, 2016

UBS: More interest in #Gold now than for past 2 years, Viewed as thefinal financial market hedge


The main buyers of gold, at least until the break of its 200-day moving average at $1130 last Wednesday, were not traditional commodity players. Rather, it was the wider macro community


- US market participants friendly to gold, but are observers rather than active players  
- Gains led by non-traditional players
- More interest in gold now, and questions about it, than for the past 2 years
- Viewed as the final financial market hedge
- Vol no longer cheap, risk reversals up to 2.5 for calls, matching the 2011 high
- For now the runup looks overdone, but buy dips


I spent last week in the US, and the topic of conversation was gold, gold and more gold - from current clients, clients that haven't been active since the tail end of the bull run, clients of my FX/equity/rates colleagues, and potential clients. In other words, everyone wanted to talk about gold. I haven't seen such interest in years.

Why the interest? The short version

Gold is currently viewed as the final financial market hedge. US data is deteriorating and the Fed won't be raising rates any time soon; China is set to contract further; CNY devaluation will continue and encourage a move into gold; negative interest rates in Europe, Switzerland and Japan make gold relatively more attractive; real yields are falling; nominal yields remain low; gold positioning is light, gross shorts still relatively high.

Given all that, there's a lot of buyers, right? Wrong: many expressed the view that they'd prefer to wait, miss the early rally and buy into momentum later on.  

Why the hesitancy? The short version

Those who are hesitant to jump in argue that, technically, this is still a bear market for gold; that the US isn't going into recession, indeed raised rates in December, and the potential for a reversal of that hike is very low; that gold (ETF) buyers have become more fickle in recent years; that physical demand is tame; that there's no inflation and little potential for it; that gold couldn't hold onto any upside moves in 2015; that in a commodity bear market, the recent rally only makes gold look very expensive; that the gold/oil ratio is too high.

These are all reasonable arguments, but the factors pushing investors into gold are considerably stronger. The 2015 price bursts were predominantly rooted in positioning, with shorts very extended and net length at low-single-digit levels. The current rally hasn't been driven by short-covering, and in fact gross shorts still remain quite high,  13.9 moz as of Feb 2, down from a high of 19.2 moz in early December but very elevated compared to the  weekly average of 6.2 moz during 2009-2011. Also net long positioning at 8.9moz is far from frothy.

Who has been buying gold? Observe the changing trends

The main buyers of gold, at least until the break of its 200-day moving average at $1130 last Wednesday, were not traditional commodity players. Rather, it was the wider macro community, which has predominantly expressed its views through long-dated (6m+) options or GLD options. Traditional players became much more active upon the break of the 200 dma and the psychologically important $1150 level. Repeatedly in meetings last week we encountered would-be participants who were happy to miss out on the early stages of the rally and buy into momentum later on. ETF inflows have been very large, 3.4 moz year-to-date. To put this into context ETF holders were net sellers last year totalling 4.2 moz. Also worth noting here is that the ETF buying hasn't just been GLD led – the GLD has seen inflows of 1.96 moz and the rest has emanated from European contracts.  

On a much smaller scale, we've seen longer-term holders buying back calls as well as private banks buying physical gold and also returning interest in fully allocated, segregated gold - the ultimate safe-haven trade. None of these have been in tremendous size, but what matters is the trend change. Currently the gold market is littered with changing trends – factors on their own which would not raise must attention, but put them together and they add up to a considerable alteration in market  dynamics. That makes me sit up and pay attention.

Despite a contained rally in January, February's move looks excessive

January 23, 2016

Will #Gold & #Silver be 2016's outperforming sector?


Light at the End of the Tunnel?

Gold's correlation to stocks decreases during economic contractions and gold's correlation to other assets remains quite low; in contrast, stocks generally increase their correlation to risk assets during these periods.

This comes from advisors at Canaccord Genuity's Vancouver office. 

Gold and Silver: An outperforming sector for 2016?


·         January 2016: In just 5 days, investors bought 26.8 metric tons of bullion through exchange-traded products backed by the metal, the most since 2015 (source: Bloomberg).
·         Gold and silver demand is off the charts; the U.S. Mint sold nearly as much gold on the first day of 2016 as in all of January 2015.  American Eagle silver coin sales jumped after the U.S. Mint said it set the first weekly allocation of 2016 at 4 million ounces, roughly four times the amount rationed in the last five months of 2015 (source: Reuters).
·         Gold has risen 3.1 percent so far this year.
  • HSBC believes that gold has "shrugged off" two bearish developments, a strong dollar and weaker commodity prices, announcing that they remain bullish on the precious metal. The group sees good emerging market demand, eventual dollar declines and central bank accumulation helping gold this year.
  • The FTSE/JSE Africa Gold Mining Index, which rallied 20 percent this year, has had the best start since 1995 (source: Bloomberg).
·         Global economic landscape for 2016 is looking ripe for further deterioration, increases in credit defaults and a "beggar-thy-neighbor" policy of rampant currency devaluations.
·         Equities look like they are rolling over into a secular bear versus gold which has bottomed and is likely resuming its bull market run.
·         Gold will resume its safe-haven status as global investors seek insurance and a potential hedge against the frailties of the monetary system.
·         Gold's run will strengthen from a currency play stance and not from traditional commodity supply & demand movements.
While the financial media's "talking heads" are busy trying to assure investors that corrections in the market are normal and to "stay the course", we are advising investors to include an allocation to gold within the portfolio.  We are not going to pretend that we can predict market movements; however we are steadfast in our belief that the volatility we are seeing is not going to stop anytime soon.  From our macro perspective, investors need to act as defensively as possible, thus if you are not selling your long equity positions you are employing strategies into the portfolio to mitigate potential losses - gold exposure can do that.  We recommend buying the physical and top-tier gold mining shares.  Mining shares are leveraged to the gold bullion price and due to a massive correction in the precious metals equities sector over the past four years; the opportunity for tremendous upside is present.  We recommend a gold portfolio weighting which is large enough that it can mitigate losses from the other asset classes.  We have created a list of gold mining companies which we think are representing above average opportunities in the sector. Our key criterion for recommendation looks at: share price depreciation from former highs, previous financing levels, successful project advancement and development and most importantly, all in sustaining costs (AISC). AISC essentially refers to the overall cost of mining an ounce of gold and selling it; an important metric in today's volatile markets.  The valuation shows the company has the ability to demonstrate strong free cash flow and has a buffer for profitability as the spot price of gold ebbs and flows.  Should you wish to review or discuss our list of gold mining companies to watch, please contact us and we will be happy to forward this information to you.
We would like to bring your attention (see below) to an investment commentary published by the World Gold Council, which outlines the fundamentals which should drive gold investment demand in 2016.
World Gold council 2016 outlook:

July 8, 2015

#Dollar/ #Loonie may have a date with six-year high as crude #oil's collapse continues | Futures Magazine


Dollar/Loonie may have a date with six-year high as crude’s collapse continues

        
Global traders remain hyper-focused on the latest Greece-related rhetoric from such influential luminaries as Latvia’s Central Bank Governor, Lithuania’s Finance Minister, and even the Finance Minister of Malta, but perhaps investors should be focusing just as much energy on the collapse in the price of: Energy.
In particular, oil has gone off the boil, with WTI falling nearly 8% in yesterday’s trade alone. Beyond an last week’s surprising increase in U.S. oil rigs and the ongoing Greek debt drama, the primary catalyst for the drop in oil has been optimism about a nuclear deal with Iran that could eventually bring up to 1 million barrels per day of the country’s oil back to the global market. Over the weekend, Russia’s Foreign Minister said that a deal with Iran “is about 90%” complete and suggested that the remaining issues were more procedural than political.
Combined with last week’s technical breakdown below 57.00, traders took these comments as a green light to drive WTI down to a low near 52.00 so far. “Black gold” is now testing the 50% Fibonacci retracement of its entire Q2 rally at 52.30, but if that level gives way, a continuation down toward the 61.8% retracement near the psychologically-significant $50 level could be next.

About the Author

Senior Technical Analyst for FOREX.com. Matt has actively traded various financial instruments including stocks, options, and forex since 2005. Each day, Matt creates research reports focusing on technical analysis of the forex, equity, and commodity markets. In his research, he utilizes candlestick patterns, classic technical indicators, and Fibonacci analysis to predict market moves. Matt is a Chartered Market Technician (CMT) and a member of the Market Technicians Association. You can reach Matt directly via e-mail (mweller@gaincapital.com) or on twitter (@MWellerFX).


May 7, 2015

#Gundlach Reiterates $1400 #Gold Target as negative rates persist

Gundlach Reiterates $1400 Gold Target

Via Energy and Gold.com:

Famed bond fund manager Jeffrey Gundlach gave a presentation at the New York Yacht Club today in which he reiterated a $1,400 target for gold by year end. From what I gather Gundlach has two primary tenets to his bullish gold thesis:

  • Negative interest rates in Europe will make gold very attractive relative to holding negative yielding cash or extremely low yielding sovereign debt
  • Fears of Fed rate hikes have been weighing on gold for some time and these fears are overblown because the US economy isn’t yet strong enough for the Fed to embark upon a protracted rate-hike cycle
One slide in particular caught our eye as being especially noteworthy:

Sovereign_Net_Issuance

Including central bank purchases both the euro area and Japan are shrinking the amount of sovereign debt in the market. This is quite significant and helps to explain why eurozone sovereign yields are at historically low levels. Gundlach is right, gold looks very attractive compared to holding euro cash or euro denominated sovereign debt. I wonder when the market is going to catch on….


The MasterMetals Blog

@MasterMetals

October 15, 2014

#Gold in #Currencies other than USD #Charts

Gold has done better in other currencies than in USD, but several charts are also at the point of breaking down.
#Gold in #Currencies other than USD

July 25, 2013

What diverging #monetary policies signal- Xie

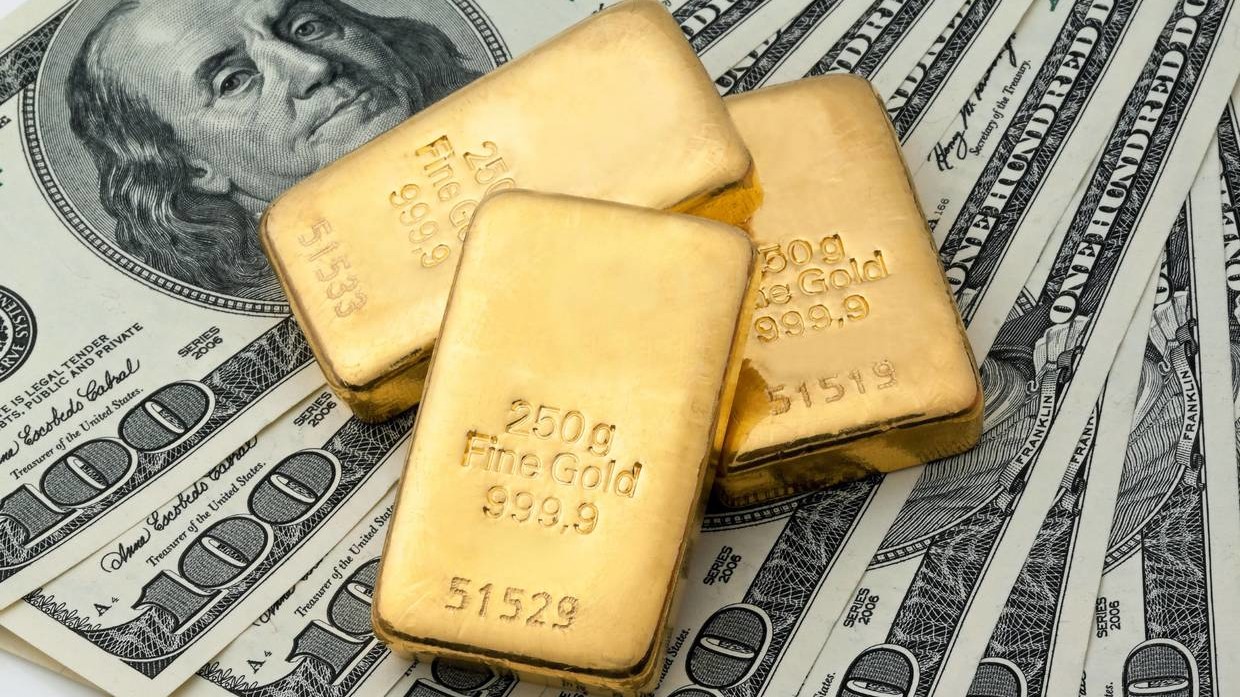
#Gold prices will top $3,000/oz in 5 years

Gold is likely to perform well in the second half of 2013

The growth outlook for Europe and Japan remains fragile. Their quantitative easing is likely to remain intact through 2013.

A limited crisis in emerging markets is still possible. As hot money is leaving them

What diverging monetary policies signal: Andy Xie

Commentary: Gold prices will top $3,000 per ounce in five years

By Andy Xie
BEIJING (Caixin Online) — The monetary policies of major economies are diverging for the first time since 2008. The euro zone, Britain and Japan are sustaining quantitative easing, while the United States, China and other major emerging economies are on a tightening path.
The divergence is creating trends in some markets, volatility and confusion in others.
The U.S. dollar DXY 0.00%  is on a strong trend, as the expectation of the Fed’s tightening is driving deleveraging of dollar-financed carry trades. On the other side of the strong dollar are a weak pound GBPUSD +0.01% , euro EURUSD -0.04%  and yen USDJPY +0.09% .
The decline of commodity currencies is the clearest trend. The Australian dollar AUDUSD -0.22% , Canadian dollar USDCAD +0.01%  and the currencies of several commodity-export-dependent emerging economies have declined sharply. The trend is likely to continue throughout the year.
Stocks will remain volatile on conflicting news regarding liquidity and growth. Fueled by asset inflation, the United States’ growth rate is picking up, and dollar liquidity is receding in anticipation of higher interest rates ahead.
The growth outlook for Europe and Japan remains fragile. Their quantitative easing is likely to remain intact through 2013. Most big companies are global in their sales and earnings. Hence, their stocks will fluctuate with mixed news on growth and liquidity.
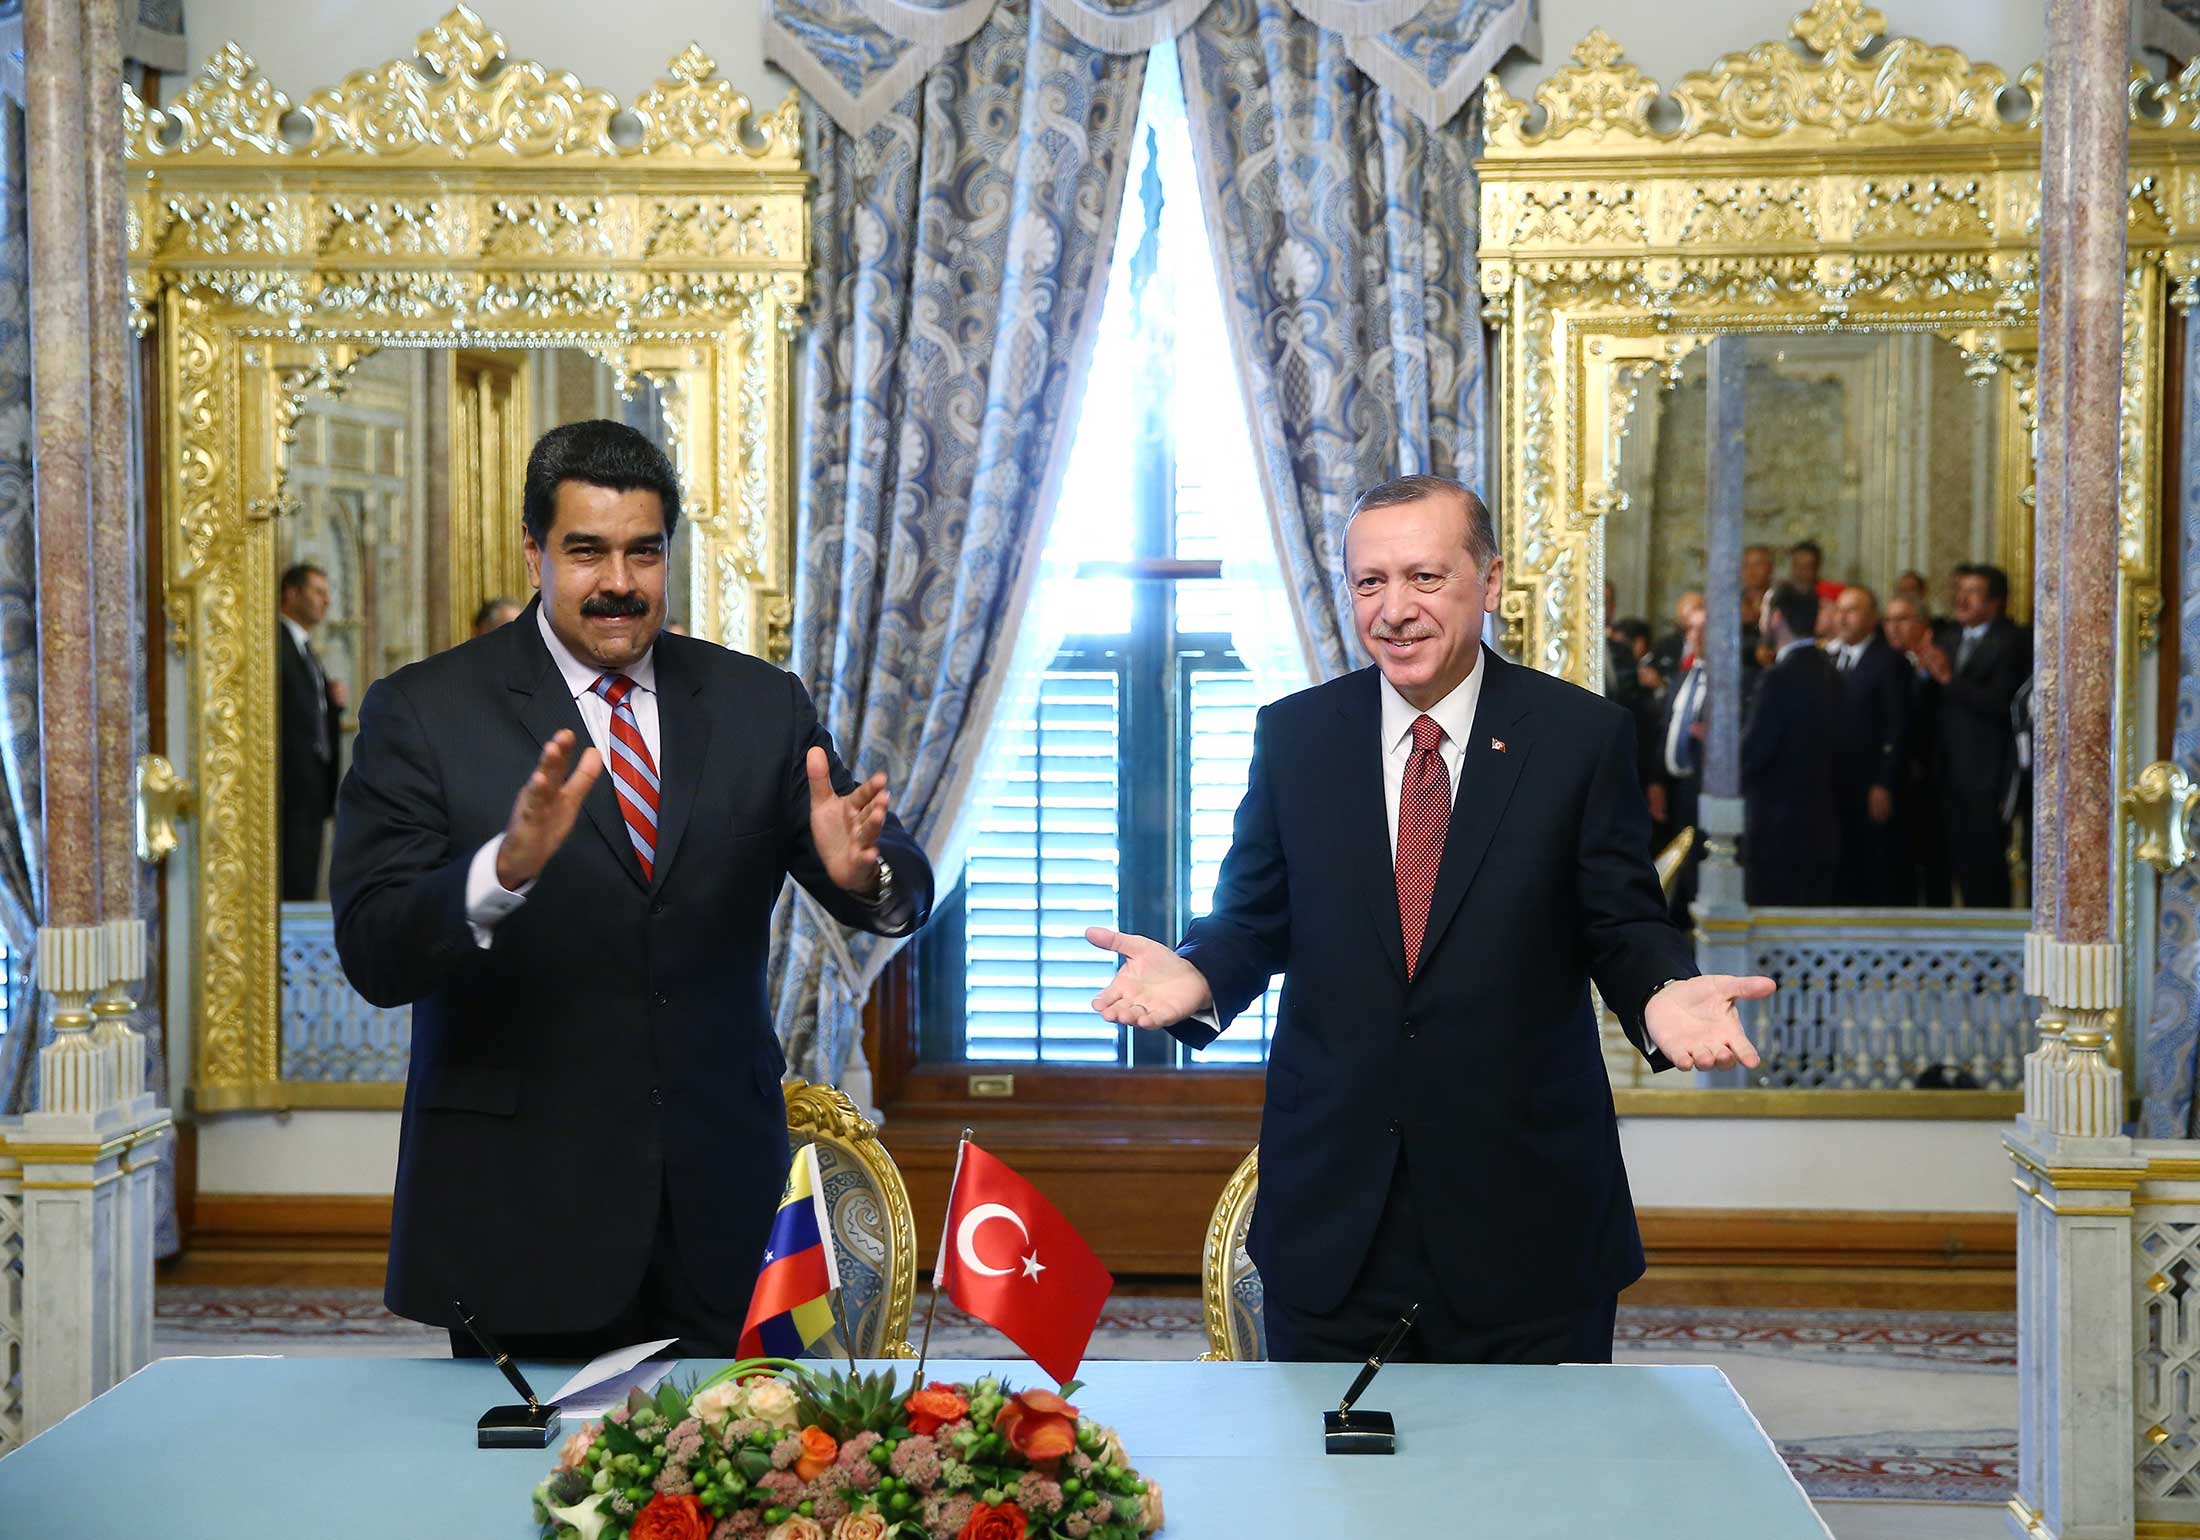
A limited crisis in emerging markets is still possible. As hot money is leaving them, they are facing difficulties in adjusting to the tighter liquidity environment. The recent political disturbances in Brazil, Egypt and Turkey amplify the uncertainties.
Gold is likely to perform well in the second half of 2013. While the rising U.S. dollar keeps downward pressure on the price of gold, rising global uncertainties support its role as a safe haven. Further, gold pricing is shifting to the East from the West.
The Shanghai market is likely to overshadow London or New York within five years. Hence, the price of gold will increasingly track China’s monetary policy rather than that of the United States.

The dollar’s long shadow

A rising dollar is the most important trend in financial markets. Its importance is in the role of dollar liquidity in carry trades since 2008. Since 2008, the Fed has communicated its intentions clearly to the financial market. It decreased the risk to using the dollar to fund speculation.
Based on the surge in the forex reserves of emerging economies, it appears that trillions of dollars of hot money have flowed into emerging economies. A strong dollar is triggering a reversal. The full consequences are yet to be felt.
The U.S. economy is recovering. Without fiscal consolidation, it could be growing at 4% to 5% now. I believe asset inflation is driving the U.S. economy. Its current net household wealth has surged 45% to $70 trillion from the low of $48 trillion in 2009, and significantly above the pre-crisis peak of $63 trillion.
The Fed’s tightening is primarily to prevent a full-blown asset bubble. Its burst could bring another financial crisis.
As the global tide of hot money recedes, the chances are that the United States’ asset markets will be resilient. Much of the hot money will just vanish due to deleveraging. Some money will be reallocated to the U.S. market from others. Hence, the United States’ asset prices are better supported than others.
In the medium term, the U.S. dollar’s outlook hinges on the continuing rise of the U.S. stock market. It is a self-fulfilling expectation.
If most investors believe in the U.S. economy, the money will flow into the country’s stock market. Its rise creates enough wealth effect to sustain the economy. The strong economy justifies the optimism. The money keeps coming.
In the longer term, if the fundamentals improve sufficiently, the bubble element in the economy could be digested through flattening out asset prices while letting the economy grow. Energy and agriculture are bright spots for the U.S. economy.
They aren’t sufficient to carry the economy. The key to the U.S. dollar’s future, in my view, is in improving the quality of the U.S. labor force. Without major progress there, the dollar will collapse again.

Changing places

The United States’ virtuous cycle depends on lack of competition for money. The main alternative is China. Since China joined the World Trade Organization, global money flow has favored it. This was a major factor triggering the weak dollar between 2002 and 2012. After 2008, the flow to China at the expense of the United States accelerated.
When international money flows to an economy and is used to enhance its competitiveness, the optimism is validated, and the money inflow will receive its appropriate reward by sharing in the growth.
However, the money could be used to finance an asset bubble. It creates paper gains for the capital inflow in the short term. The optimism is validated too, which encourages more inflow. But, this is an unsustainable dynamic. When the bubble peaks, everyone realizes that the optimism is misplaced. Capital flight follows, and with it the bubble bursts.
China’s economy was mismanaged after 2008. Instead of learning from the bubble disaster of the United States and embarking on structural reforms to improve competitiveness, China merely used fiscal and monetary stimulus to amplify an existing bubble, creating a feeding frenzy of getting rich overnight. As the U.S. economy improves and attracts more money, China’s bubble bursts.
To reverse the situation, China must embark on structural reforms to improve competitiveness. It has a major advantage over the United States. With per capita income of $6,000, its growth potential is far greater. If the reforms can convince the market that China’s potential can be realized, the money will return.
The competition between China and the United States for money is a key global dynamic. The yo-yo dynamic between the two will dominate the global economy for decades. It amplifies the up-and-down cycle in either.
As the composition of growth is quite different between the two, other economies will float up or down depending on their relationships with either.

Commodity currencies

The yo-yo dynamic now is in favor of the United States. Hence, the economies that have benefited from China’s boom are suffering. Commodity exporters are the most exposed. Their currencies are adjusting to reflect the new reality.
The Australian dollar has declined nearly one-fifth from its peak. There is much more to come. The most vulnerable commodities to China’s down cycle are industrial minerals.
Since China joined the World Trade Organization, the price of iron ore rose nearly ten times. Australia has benefited enormously from the trend. It suffers most on the way down too. The Australian dollar’s adjustment is not half done, in my view.
I thought that oil would be resilient compared to industrial minerals because it cannot be recycled. It has performed even better than I expected.
China’s electricity production has slowed two-thirds. The price of oil should have halved. But Brent crude remains above $100 per barrel, down less than 20% from the last year’s peak. Its strength is probably due to Saudi Arabia managing supply and the turmoil in the Middle East.
The uniqueness of the energy story suggests that the currencies of energy exporters like Canada and Russia perform better than that of mineral exporters like Australia and Brazil.
Emerging economies as a whole are facing difficulties. They suffer declining export prices and hot money leaving. To stop a vicious spiral of currency depreciation and inflation, they have to tighten monetary policy in an economic downturn.
If they try to protect growth by easing monetary policy, the vicious spiral could lead to another emerging market crisis like in 1998.

Gold moves East

There is a negative correlation between the U.S. dollar and gold in recent history. In light of the strong dollar, huge amounts of short positions have been built up in gold and gold stocks. I suspect that the correlation won’t work in the second half, and such short trades will turn out badly.
At the beginning of the year, I expected that a strong U.S. dollar would pressure the price of gold in the first half. But it would perform better in the second half as the U.S. stock market slows, diverging less money away from gold.
A new factor strengthens the case for gold. The physical demand has been extraordinarily strong in response to the slide in the price of gold. This could be a turning point in gold history. The pricing of gold may move permanently to the East from the West.
China and India account for roughly two-thirds of global demand for gold. Other emerging economies account for most of the rest. But, the price of gold is fixed in London or New York and driven by U.S. monetary policy. This is obviously wrong. But inertia is a powerful force. Financial markets continue with what has worked in the past.
The tension between where gold is priced and where demand is located is manifesting itself in two ways: first, gold shops in Asia have no physical gold to meet demand; and second, the price of gold set in Shanghai is consistently higher than in London or New York.
Physical gold is likely to flow from the West to the East due to the pricing gap. It is only a matter of time before the warehouses of London and New York are emptied.
When the stock is all shifted to the East, the price fixed in Shanghai will become the real price. The gold exchanges in the West will wither.
China lost gold to the West from the mid-19th century onwards. Domestic uncertainties drove waves of immigration financed by gold. The trend has reversed over the past decade. And the trend is likely to accelerate in the coming decades.
India has the most gold in the world. The Fed has the most gold reserves among all central banks. China is likely to surpass both in the coming decade.
Gold is a substitute for money. Gold production is about 3,500 tons per year and is worth $154 billion or 951 billion yuan ($154.9 billion) USDCNY +0.01% . China’s M2 is likely to rise by 14 trillion yuan or 16 times the gold supply.
Within five years, China’s M2 could rise by 2 trillion yuan per month, while the supply of gold will remain the same. Gold should trade with China’s money supply, not with that of the United States.
In addition to China, India will remain the second largest source of demand. Even if its economy grows at 5% per year, proportionally, its gold demand will increase by 28% in five years.
As the Bank of Japan targets 2% inflation, the Japanese have become a force in gold demand too. Looking beyond the shadow of the strong U.S. dollar, gold has a very bright future. I believe that the price of gold will top $3,000 per ounce in five years.


What diverging monetary policies signal: Andy Xie - Caixin Online - MarketWatch


July 9, 2013

Analysis of the day:Rogoff: collapse of #gold has not changed investment case- policymakers: be cautious interpreting it as vote of confidence

collapse of has not changed investment case- policymakers: be cautious interpreting it as vote of confidence


Twitter / MasterMetals: collapse of #gold has not changed ...

The MasterMetals Blog

#Paulson #gold #fund plunges 65% through June

With roughly $300 million in assets, the gold fund is the smallest portfolio in his New York-based firm's lineup with less than 2 percent of its assets and it invests mostly Paulson's personal money
The fund's assets have fallen from roughly $700 million at the end of the first quarter

John Paulson's gold fund has lost 65% of its value so far this year after it declined 23% last month, says people familiar with the matter.


Paulson gold fund plunges 65% through June


Author: Svea Herbst-Bayliss & Katya Wachtel (Reuters)
Posted: Tuesday , 09 Jul 2013

BOSTON (Reuters) - 

Hedge fund manager John Paulson's gold fund has lost 65 percent of its worth so far this year after the portfolio declined 23 percent last month, two people familiar with the fund said on Monday.
Gold had been one of the billionaire investor's winning bets a few years ago, but not this year. His investments in gold and gold miners have suffered double digit losses for the past three months.
In June, gold tumbled 12 percent in the wake of fears the Federal Reserve might taper its economic stimulus by cutting monthly bond purchases. It is unclear how a 12 percent drop in the price of the precious metal translated into a 23 percent fall in the fund in June, and whether it is the result of the bet having been leveraged up through borrowing and the use of derivatives
A spokesman for Paulson declined to comment.
With roughly $300 million in assets, the gold fund is the smallest portfolio in his New York-based firm's lineup with less than 2 percent of its assets and it invests mostly Paulson's personal money, the people familiar with the fund said.
The fund's assets have fallen from roughly $700 million at the end of the first quarter, according to those people.
They did not want to be identified because the information is private.
The gold fund, which at one point managed almost $1 billion, rose 35 percent in 2010 and contributed to Paulson's estimated $5 billion payday that year.
As the heavy losses made for outsized headlines in recent months, Paulson decided a few weeks ago to report the gold data only to the gold fund investors, not investors in his bigger and better performing funds. In April, Paulson garnered unwanted attention when the gold fund lost 27 percent as the price of the metal plunged 17 per cent over two weeks.
"Paulson's impact on the gold market is dramatic. In particular his size alone, on the way in or way out," said John Brynjolfsson, managing director of global macro hedge fund Armored Wolf LLC. "But one needs to look beyond his size alone because his positions are relatively widely publicized, and representative of how others are thinking, so thereby their impact gets magnified."
The gold fund is one of a handful of funds that make up Paulson's New York-based hedge fund, which at its peak in 2011 managed about $38 billion. The firm now oversees about $19 billion in investor money.
Most of Paulson's bigger funds are in the black this year, but the gold investments have weighed down returns of the Advantage Funds, which lost 3.06 percent last month, shrinking the year's gains to 1.17 percent.
Paulson & Co's largest holding by market value at the end of the first quarter was the SPDR Gold ETF, with 21.8 million shares, according to a regulatory filing. The firm also had large stakes in gold mining companies through March, those filings showed.
Paulson launched his gold fund in 2010, requiring outside investors to commit $10 million each. He hired gold industry experts Victor Flores, HSBC's former senior gold mining analyst, and John Reade, a former senior metals strategist at UBS. The fund is now called the PFR Gold Fund, in a nod to their last names.
Paulson's investments in gold are one reason he rose to prominence on Wall Street.
After earning billions betting against the housing market before the financial crisis, Paulson made roughly $5 billion in 2010 thanks to prescient bets on the economic recovery and gold.
Paulson is not the only brand-name manager hit by the gold rout. David Einhorn's Greenlight Capital Management's offshore gold fund fell 11.8 percent in June, bringing year-to-date losses in the fund to 20 percent, Reuters has reported.


Paulson gold fund plunges 65% through June - GOLD NEWS - Mineweb.com Mineweb

The MasterMetals Blog

ShareThis

MasterMetals’ Tweets